Data Strategies for Online Stores: How to Combine All Your Data & Create a Single Source of Truth
Data powers ecommerce decisions. Understanding and effectively interpreting data about customer behavior is the key to making profitable choices.
But there’s a big roadblock to using data: It’s notoriously cumbersome to gather and interpret because it’s scattered among all the channels, platforms, and tools that ecommerce companies use.
That’s why it’s vital to create a single source of truth combining all your ecommerce data in one place. Once you can see your up-to-date data in one place, you can speed up your decision making, reduce the manpower required to gather data, and increase profits.
How Data Improves Ecommerce Decision-Making
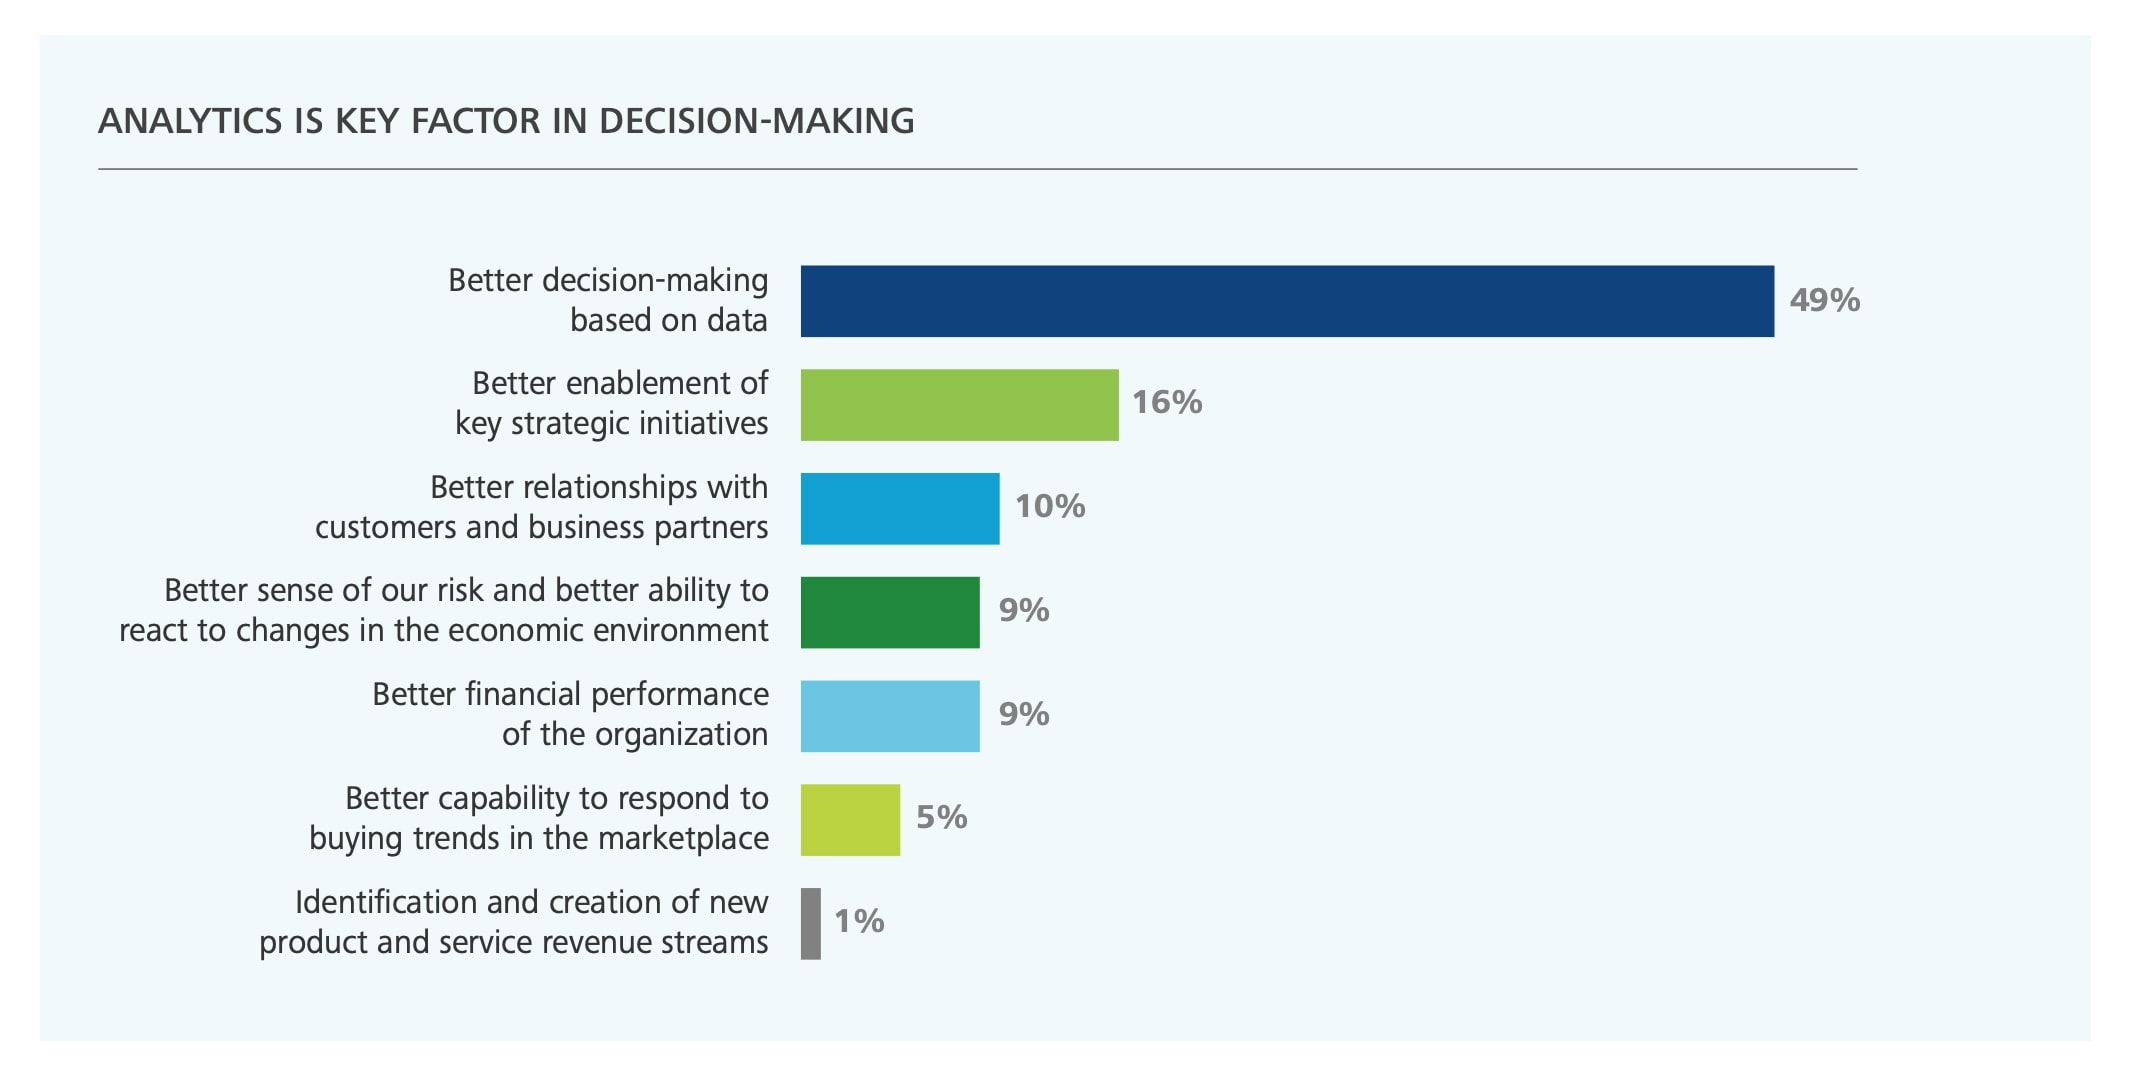
Data supercharges ecommerce decisions because it leaves nothing up to guesswork. Deloitte found that 49% of senior executives said they use data to guide their decisions, and 96% of them predicted that data would become even more important in the future.
Here’s how data helps you decide what’s best for your company.
Know What Your Customers Want
If there’s a simple secret to a profitable ecommerce business, it’s having a product and brand experience that customers want.
Data can help you pinpoint what customers want on a granular level, optimizing every stage of the customer journey for more conversions. For example, data can reveal where customers exit as they navigate through your website (or sales funnel), and then your team can make changes until that “leak” is plugged.
Data can even help you decide what products to create and which to let go of (freeing up valuable inventory space). As customers repeatedly buy one type of product and not another, the answer becomes clear.
Know Which Marketing Tactics are Worth It
Marketing is about minimizing cost and maximizing return. Data helps you see which marketing tactics do this well and which cost more time or money than is worth spending for the return on investment (ROI).
Marketing is about minimizing cost and maximizing return. Data helps you see which marketing tactics do this well and which cost more time or money than is worth spending for the return on investment.
Especially for new or growing ecommerce brands, it’s important to know which marketing campaigns work well, which platforms have the highest ROI, and which ads have a significant return (ROAS).
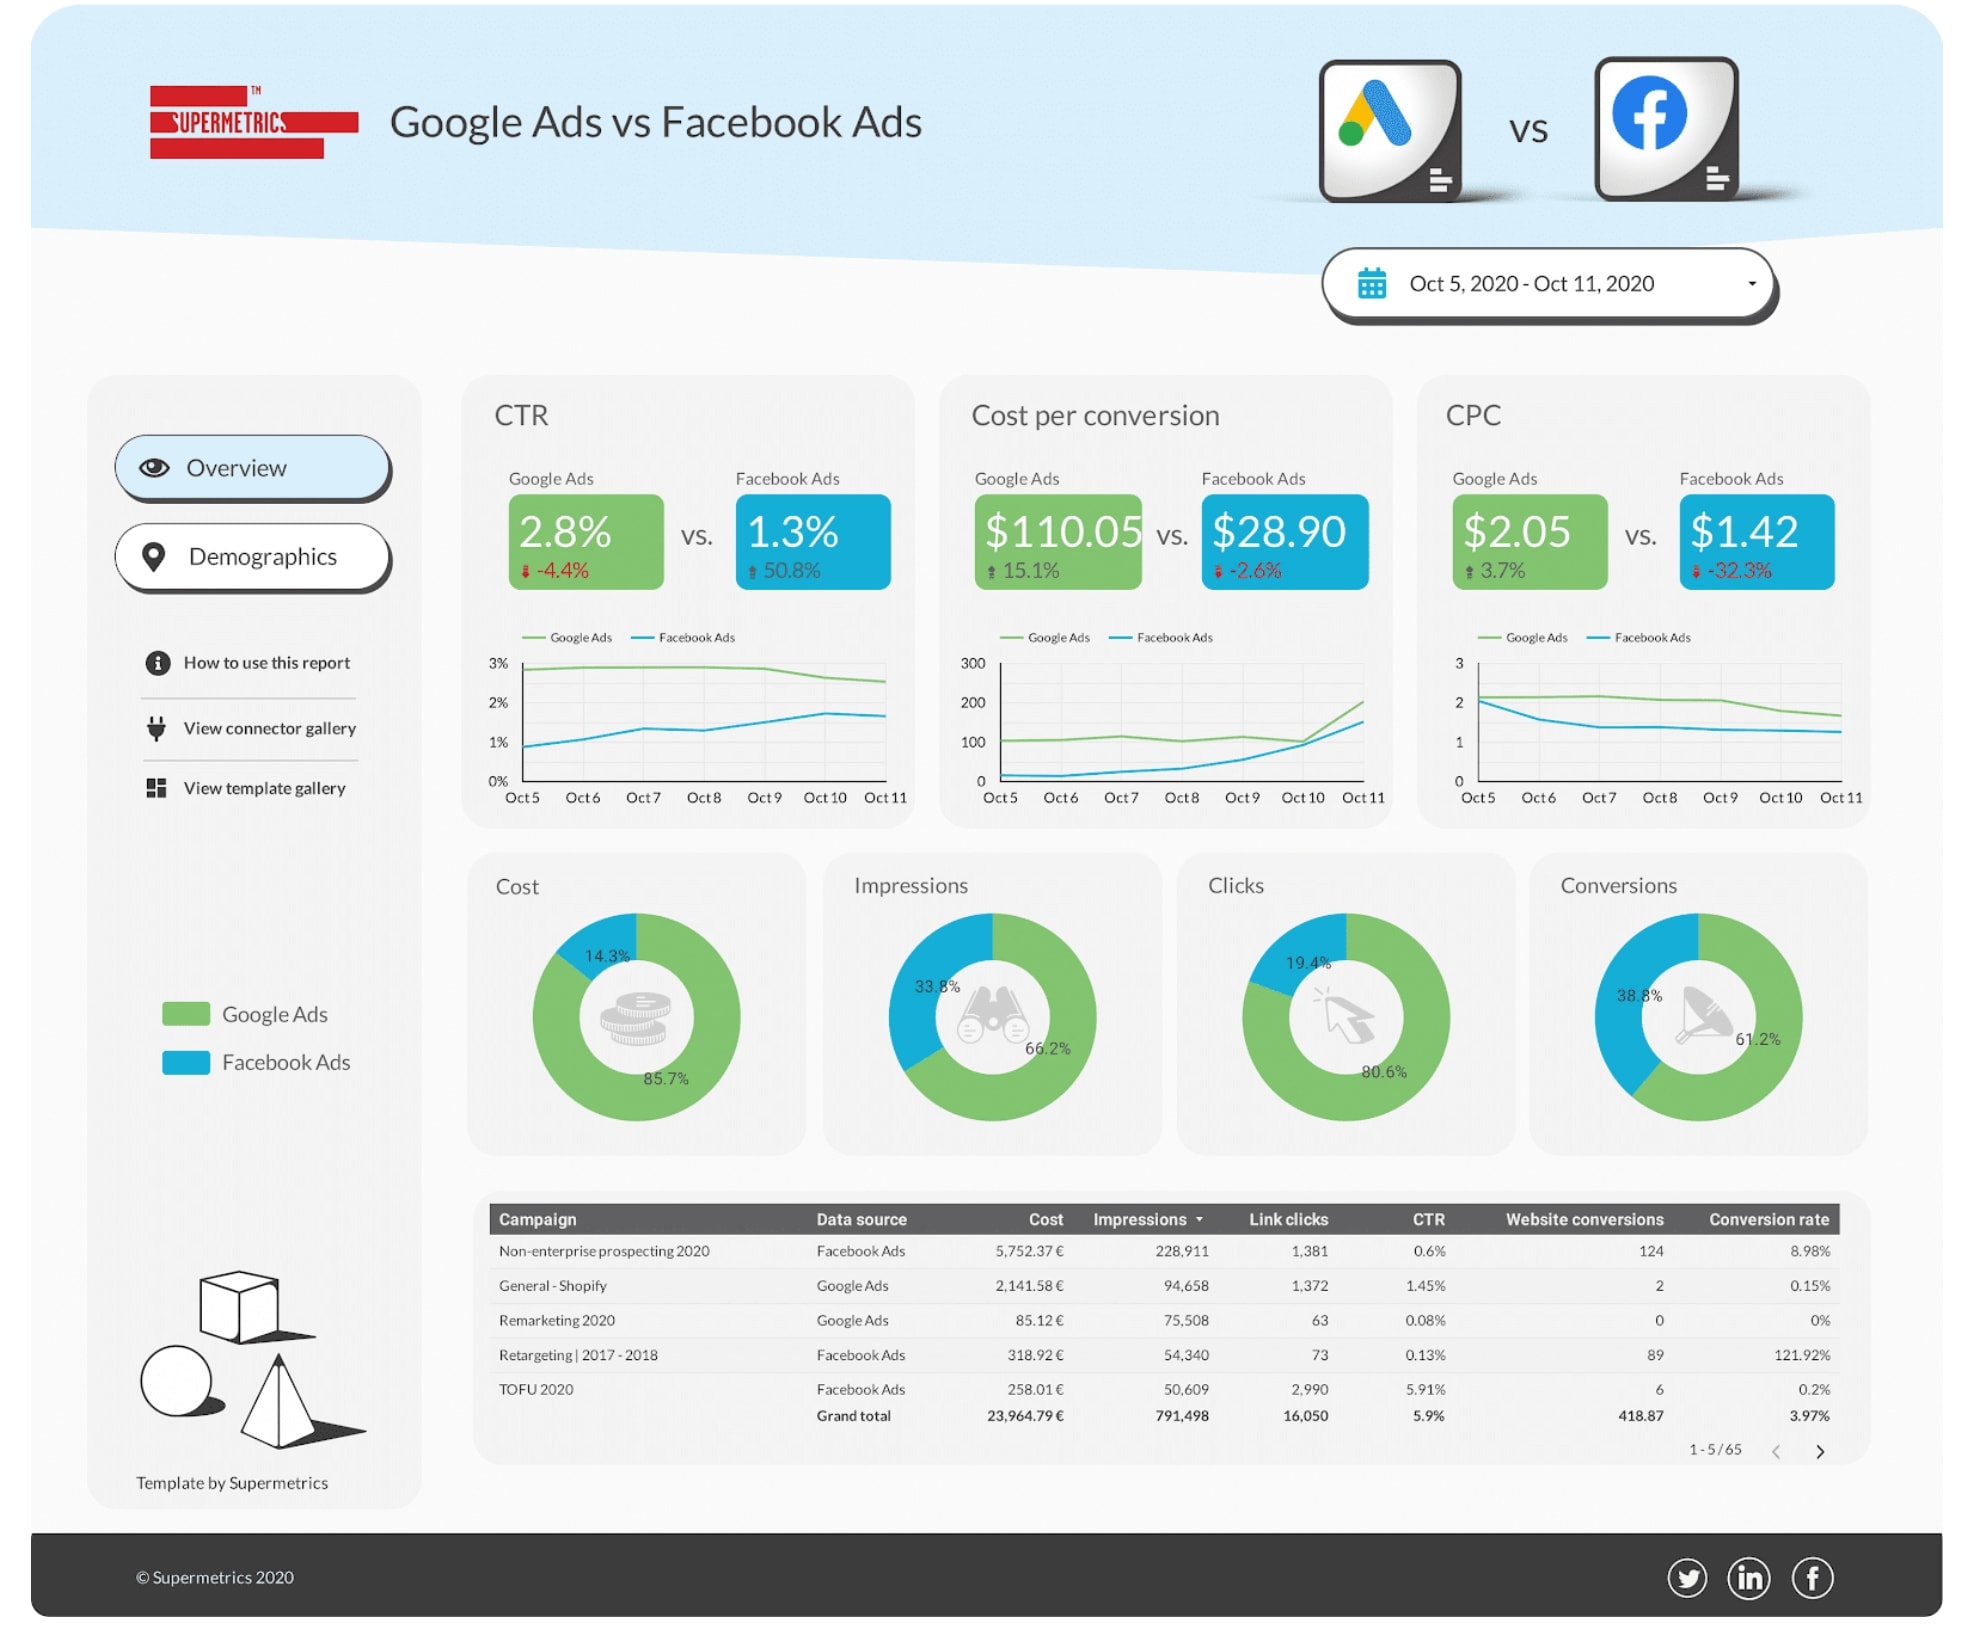
For example, let’s say you’ve invested in Facebook and Google ads for your store. By combining all your ecommerce data in one place, you can easily see which type of advertising performs best for your brand. Some data aggregators allow you to create easy-to-analyze comparison dashboards, like the one below:
(Source)
In our example, you can see that while Google ads are delivering a higher click-through rate (CTR) and more exposure, the cost per conversion (CPC) is significantly higher than Facebook ads. You might decide based on this data that it’s best to focus on optimizing your Facebook ads for higher CTR and cease Google ads to reduce ad spend.
In short: Data helps you double down on what works. It also helps you eliminate or change what doesn’t work so that you’re never wasting money.
This is the key to turning your marketing into a money-making machine.
Know how to Upsell & Cross-Sell Effectively
You’re probably familiar with the oft-quoted statistic that it costs five times more to acquire a new customer than it does to sell to existing ones.
The fastest path to profit for ecommerce is to focus on your existing customers to increase your average order value (AOV) and lifetime value (LTV). Data can help you improve these key metrics.
For example, let’s say you’re looking for a promising upsell or cross-sell opportunity. You can use data to discover…
- Which products are bought most often
- Which products are bought together often
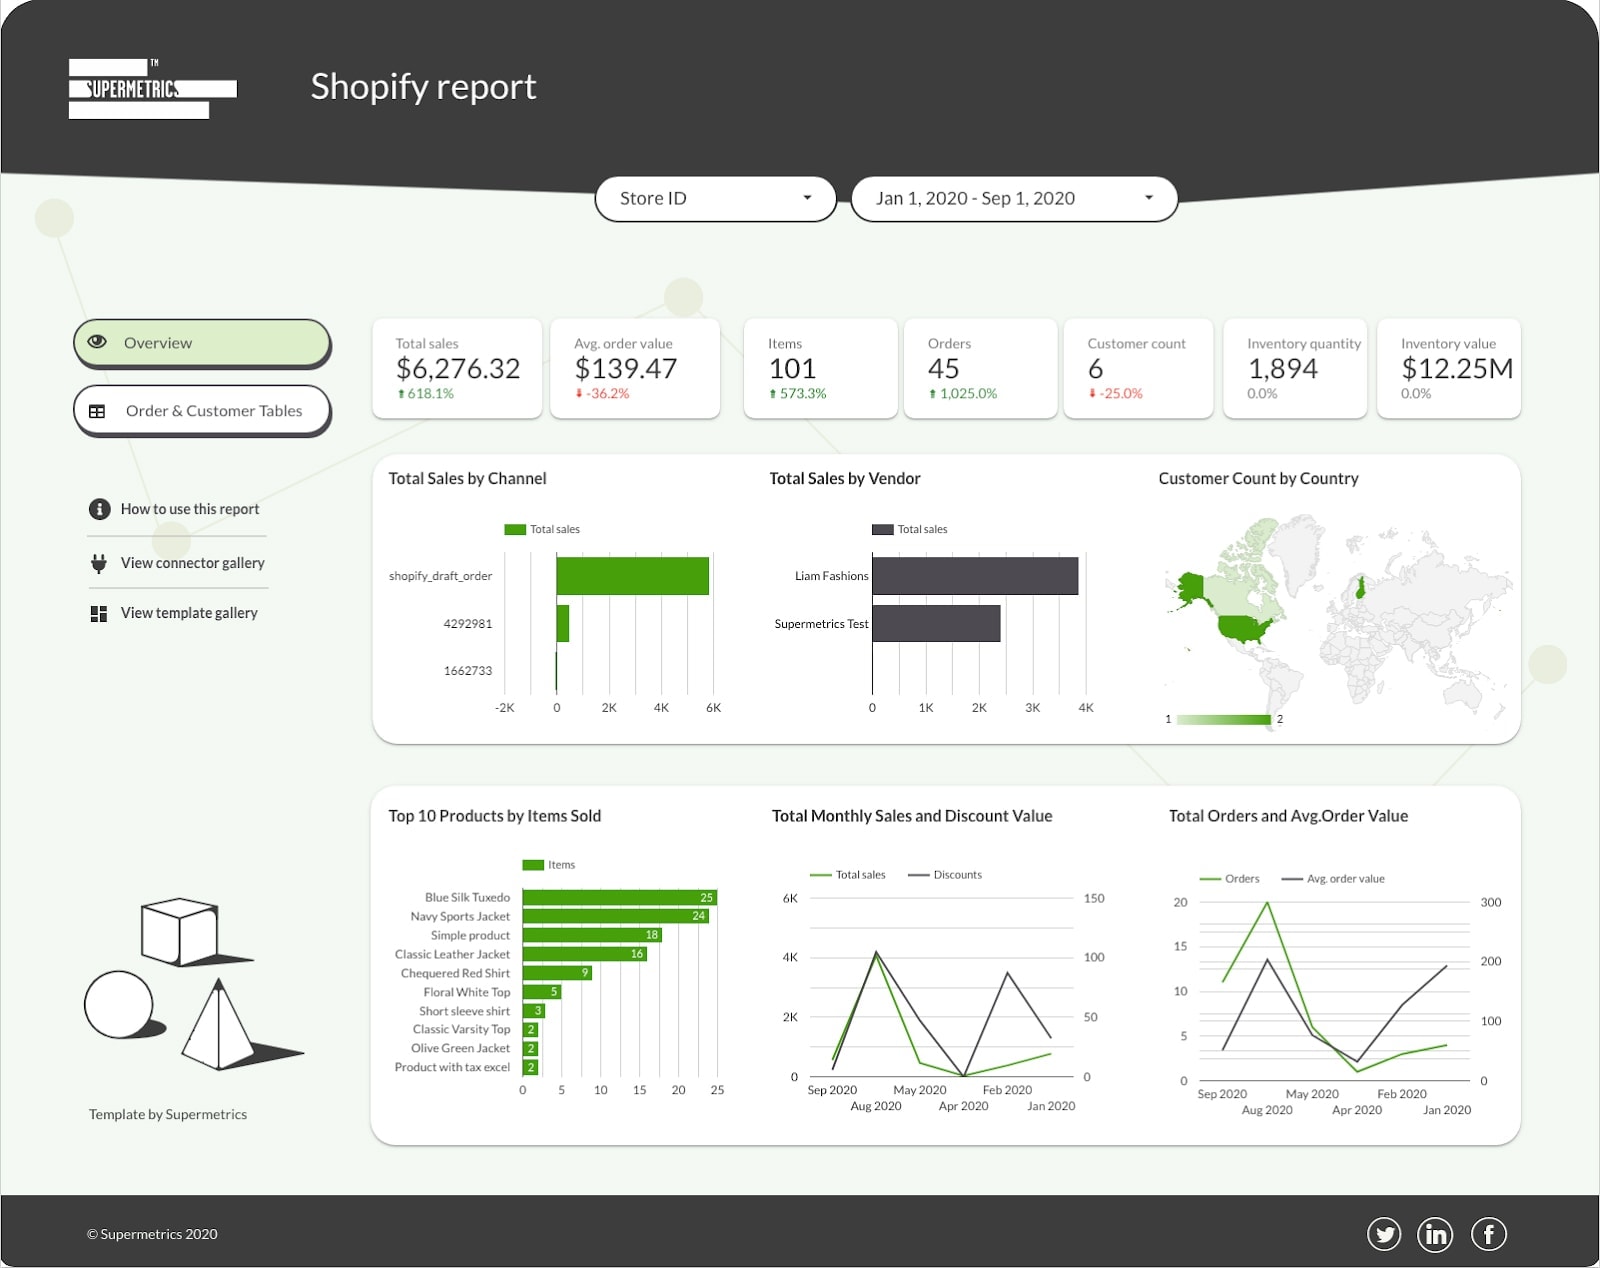
And then use that data to upsell to customers. Take a look at the following example report for a Shopify store:
(Source)
You can conclude that starting with a cross-sell offer of your top product sold, “Blue Silk Tuxedo” is likely to perform well.
Then, data can help you keep a close eye on your cross-sell campaign to ensure that it is indeed effective.
Know How to Optimize Conversion Rates
Without data, you might be able to estimate how well your marketing campaign is doing based on how many people buy your product. But you won’t be able to do much with that information.
You’d have to guess why people are or are not buying. Is it the copy in your ad? Is the platform you chose? Is it your landing page design? Is it the product?
Data removes the guesswork. It can reveal exactly what’s working and not working at every stage of a marketing campaign. This makes it easy to plug leaky funnels. You can follow the data to strategically adjust parts of your campaign until your funnel is converting optimally.
(Source)
The Challenge: Gathering Data in One Central Place
With data powering ecommerce decisions, why aren’t all companies profitable? It would seem that with data backing up every move you make, success should be inevitable.
However, many ecommerce companies aren’t using data effectively because of one common roadblock: The challenge of gathering data in one central place for efficient and accurate analysis.
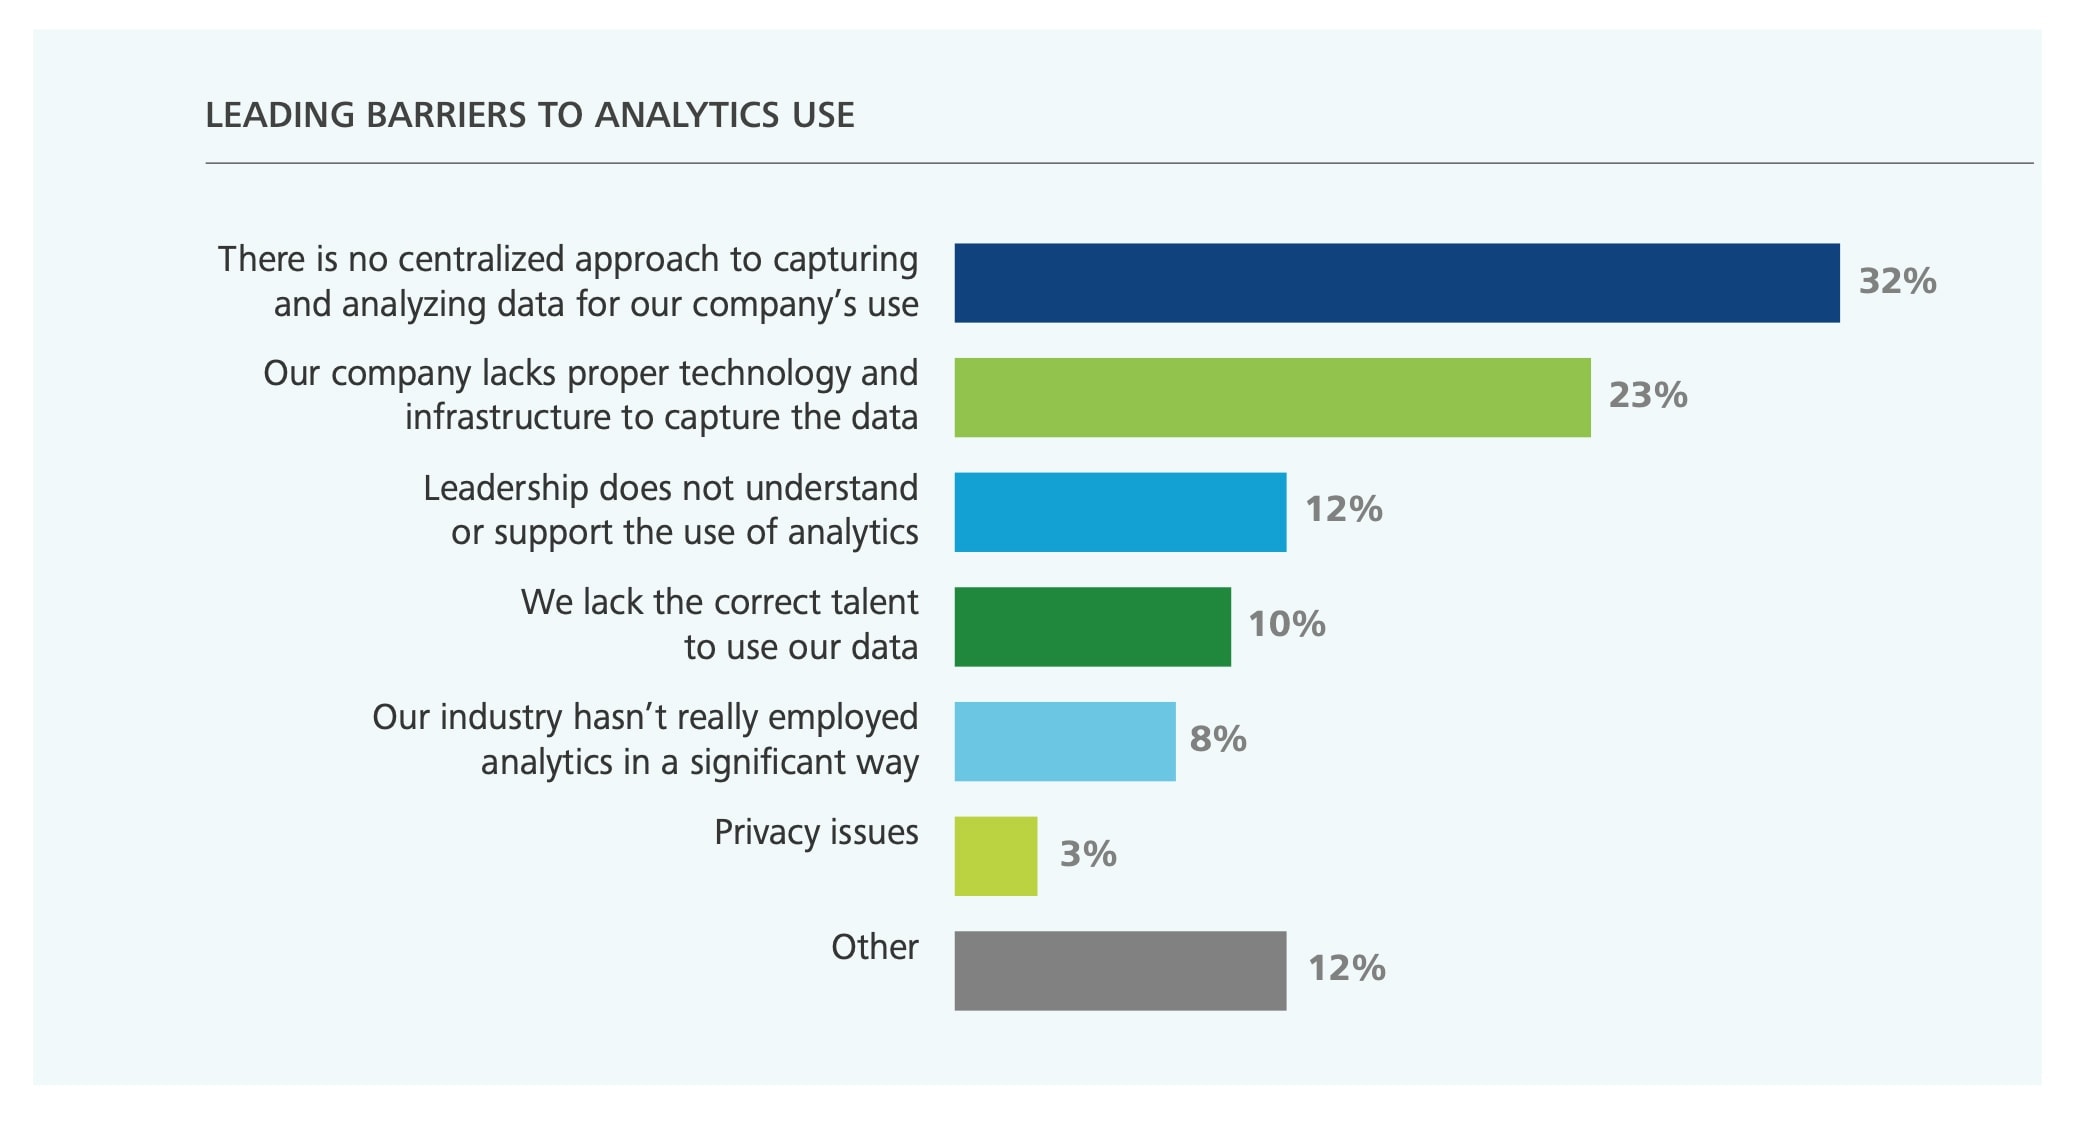
32% of senior executives reported that having “no centralized approach to capturing and analyzing data for our company’s use” is the biggest barrier to using analytics.
Without an efficient way to harness and organize data, it’s virtually impossible to get the full picture. Consequently, even data-backed decisions might be made in error.
Most companies know this, and so spend lots of manpower to cobble together a solution. The typical way of consolidating data from multiple sources is to do it by hand, copy/pasting from each individual channel:
- Google Analytics
- Shopify Analytics (or WooCommerce, BigCommerce, etc.)
- Facebook and Instagram ads
- TikTok ads
- Google ads
- Email campaigns
- Influencer marketing campaigns
- Press features
- Affiliate marketing links
And possibly many more.
Especially if companies create a funnel that involves more than one of the above channels, such as a Facebook ad to a landing page to an email campaign, it becomes exceedingly challenging to interpret the data for each of the parts in a way that still facilitates a view of the whole funnel.
Moreover, this copy/paste method is likely to result in human error and take up unnecessary time and funds.
(Source)
Methods to Create a Single Source of Truth
Along with the traditional spreadsheet, there are more advanced options for aggregating your data into a single source of truth.
The option that will be best for your company depends on your needs and the complexity of your data. Let’s take a look at the pros and cons of the major options.
Spreadsheets
Spreadsheets are the starting place for analyzing data, housing all your numbers in Excel or Google Sheets.
Pros of Spreadsheets for Data Aggregation
The biggest draw of a spreadsheet is its inherent simplicity:
- No Learning Curve: Most team members are familiar with spreadsheets
- Easy to Use: Can copy/paste data from anywhere
- Easy to Analyze: Basic data crunching for insights
- Shareable: Google Sheets and Excel are typically available on every computer
Cons of Spreadsheets for Data Aggregation
Spreadsheets are limited in what they can do and how helpful they can be for reaching your goals—and these limits become big problems as your company and marketing expand:
- Limited Cell Space: Large amounts of data from multiple sources won’t fit
- Limited Queries: More complex queries can’t be performed
- Not Ideal for Historical Data: Historical data would quickly overwhelm a spreadsheet
- Not Automated: Manual copy/paste method is slow and difficult
Are Spreadsheets Right For You?
Spreadsheets can be ideal for your brand if…
- You are a micro to small company
- Your marketing is limited to only a handful of channels
- You don’t yet need to run complex queries
- You want a data aggregator you can implement right away with no learning curve or investment
Data Visualization Tools
A data visualization tool (such as Tableau, Power BI, or Google Data Studio) goes beyond a spreadsheet to organize your data in a visual way. This helps team members get a quick overview of what’s happening throughout all channels.
Pros of Data Visualization Tools
Data visualization tools are perfect for fast, high-level insights:
- Automated Dashboards: No need to copy/paste to view data
- Important Information First: Insights at a glance (no need to crunch the data)
- Easy to Understand: Ideal for presenting to leadership teams (who aren’t data analysts)
Cons of Data Visualization Tools
The eagle-eye view that data visualization tools provide can also be a drawback in some contexts:
- Oversimplification of Data: Might miss nuanced insights
- Shows Only “Important” Data: Data deemed “less important” might be left out of the analysis
- Reliance on Tool to Interpret Data: No interaction with the raw data to draw your own conclusions
Are Data Visualization Tools Right for You?
Data visualization tools can be excellent additions for data analysis, particularly in situations where you don’t have time to carefully inspect all your data yourself and need fast insights.
For this reason, data visualization tools are recommended for companies that…
- Want to dip their toe into using data to guide their decisions
- Don’t have trained data analytics team, but still want insights into the data
- Need to supplement a raw data solution (like a spreadsheet) with big picture analysis
Data Warehouses
Data warehouses are central locations for all your company’s data—historical and new.
Pros of Data Warehouses
The biggest benefit of data warehouses is that they are a complete solution to data aggregation:
- Complete Data from All Sources: No limits to the amount of data you can store
- Instant Access to Data: Ability to make rapid, data-informed decisions
- Space for Historical Data: Predict future trends based on a long history of data trends
Cons of Data Warehouses
The potential downsides with data warehouses are centered in the investment they require:
- Pricey: Data warehouses cost the most of all solutions
- Requires SQL Knowledge: Not beginner-friendly
- Complex Set-Up: Big IT projects like data warehouses take time to create
Are Data Warehouses Right for You?
Data warehouses can help you quickly scale your business. But they do require more time and financial investment, plus SQL knowledge. For this reason, data warehouses are best for companies that…
- Are ready to scale (or are already at enterprise-level)
- Have multiple marketing channels to track data for
- Want to be 100% confident decisions are backed by the data (no guesswork)
How a Data Aggregator Spurs Ecommerce Growth
Many companies might find that a hybrid approach to data aggregation works best. For example, they might store their historical data in a data warehouse, visualize it in a data visualization tool, and do simple data crunching in a spreadsheet.
But one thing will be true no matter which solutions you choose: Automating the gathering of data is crucial to avoiding hours of tedium and lost revenue.
This is where a data aggregator comes in.
A data aggregator automatically pulls all of your data into the right places (a spreadsheet, visualization tool, or warehouse) to create a hands-free single source of truth.
Here’s how having a data aggregator spurs growth:
No Time Lag or Human Error
Unlike the copy/paste method, a data aggregator pulls data automatically, so every bit of data is always up-to-date. Additionally, there is far less chance for human error.
This allows you to make solid, data-backed decisions without wondering whether your data is accurate.
One Streamlined Way to Read Data
Without a data aggregator, you or your team members must keep up with changes in dozens of platforms in order to access and interpret your data.
But with everything in one place, it’s not only faster to read your data—it’s easier. And there’s no need to train new hires on every single platform, which means they’ll contribute more quickly to revenue generation.
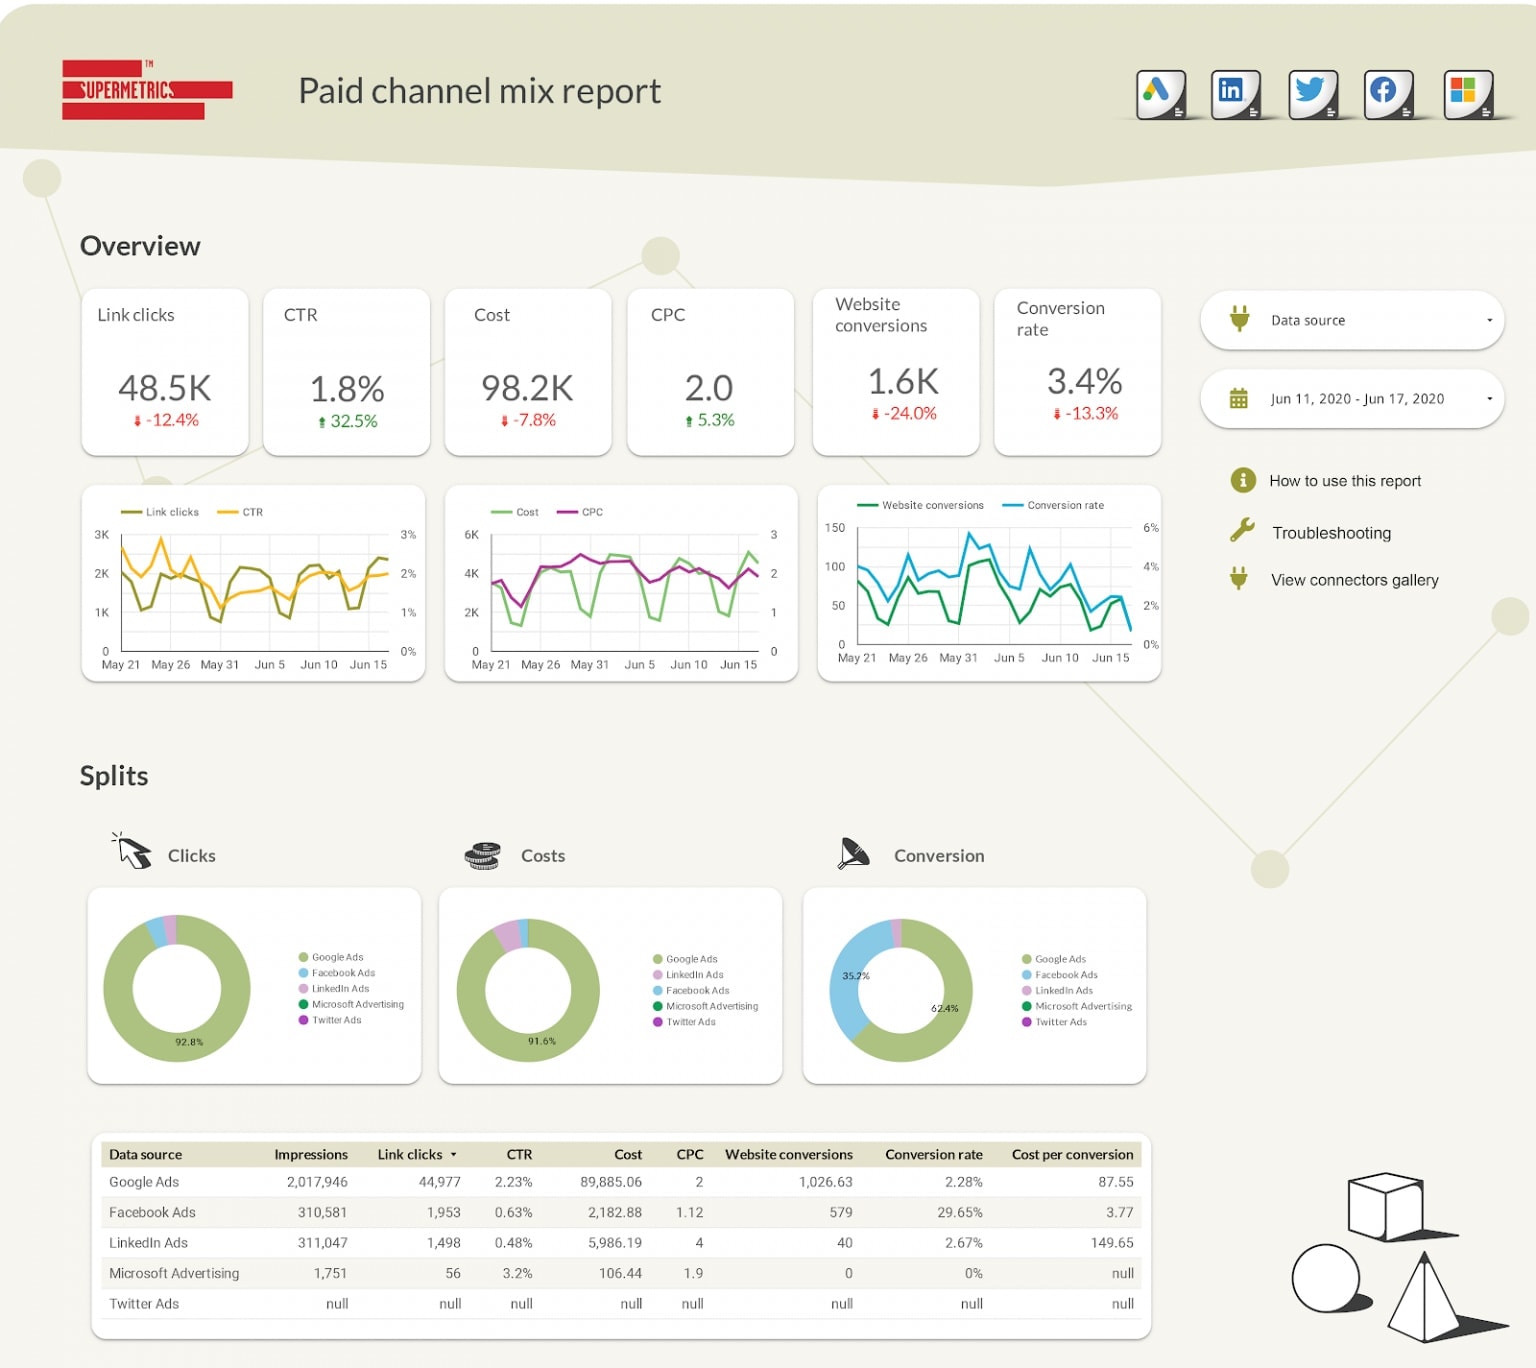
For example, you can create at-a-glance reports to compare data from multiple sources, like this report detailing the metrics of all paid marketing across channels:
(Source)
More Brainpower for Revenue-Generating Activities
Automating data consolidation means you take that tedious burden off yourself or your team. Instead, team members can spend that energy and time on high-level, strategic activities that will lead to revenue.
For example, the less time spent on collecting data, the more time you can spend on interpreting the data and making decisions that move your company forward.
No Need for Dozens of Configurations & Integrations
Some companies may have experimented with using tools like Zapier to create their own piece-mealed solution to the challenge of data consolidation.
But setting up these configurations takes time and energy, and it can be a hassle to adjust every time something changes.
A data aggregator is designed to pull your data automatically, from all sources, without a third-party connecting the dots.
On-Brand Experience Across Channels
A data aggregator helps you make a sweeping decision for your brand across channels because you get a bird’s eye view of the data.
With your data all in one place, you are able to recognize bigger patterns and trends that surpass the limits of one particular channel. Therefore, you are able to create a strategy that is aligned across your entire brand. Ultimately, this leads to an on-brand experience across channels for your customers.
Faster Growth with Sound Decisions
A data aggregator takes the power of data and makes it more accessible, allowing you to use it to scale faster.
For example, consider the lightning-fast trajectory of retail company Flying Tiger Copenhagen.
Flying Tiger had already had numerous successful brick-and-mortar retail locations but wanted to expand into ecommerce. They had a huge customer base and inventory, so they needed a way to quickly scale and gather the masses of data automatically (or risk an ecommerce flop).
A single source of truth for their data was the only answer. They chose to use data aggregator Supermetrics to automatically pull all their data into BigQuery.
Since Flying Tiger needed to scale quickly, they couldn’t spend time learning a new dashboard for their data. So, it was crucial that they were able to continue with a platform they were already familiar with—BigQuery—while still getting the automatic data consolidation benefits.
Now, with their data in an easy-to-access single location, Flying Tiger is able to effectively scale their ecommerce wing to rival their retail success.

(Source)
How to Choose a Data Aggregator
Not all data aggregators are created equal. You should choose carefully to avoid wasting your time and financial investment.
The following are features to look for in a data aggregator.
Pulls All Data—Not Limited Data—From Your Marketing Channels
Pulling data should be about quality, not quantity. It’s rare that a single company will use hundreds of different marketing and sales channels. Most ecommerce stores have a key circle of marketing and sales channels that they can pay close attention to.
So, don’t look for a data aggregator that pulls a little bit of data from every marketing channel in existence. Instead, look for a data aggregator that pulls all the data from the key marketing channels you use.
Complete, quality connections with the channels you actually use are what will matter for your business.
Serves Ecommerce Companies Specifically
Choose a data aggregator that was built to serve ecommerce.
Ecommerce businesses have different needs and different data sources than other types of businesses. A generalist data aggregator will likely have features that won’t be relevant to ecommerce, and it may not contain key ecommerce features because they aren’t relevant to other types of businesses.
Gathers Data Directly Into Your Favorite Analytics Tool
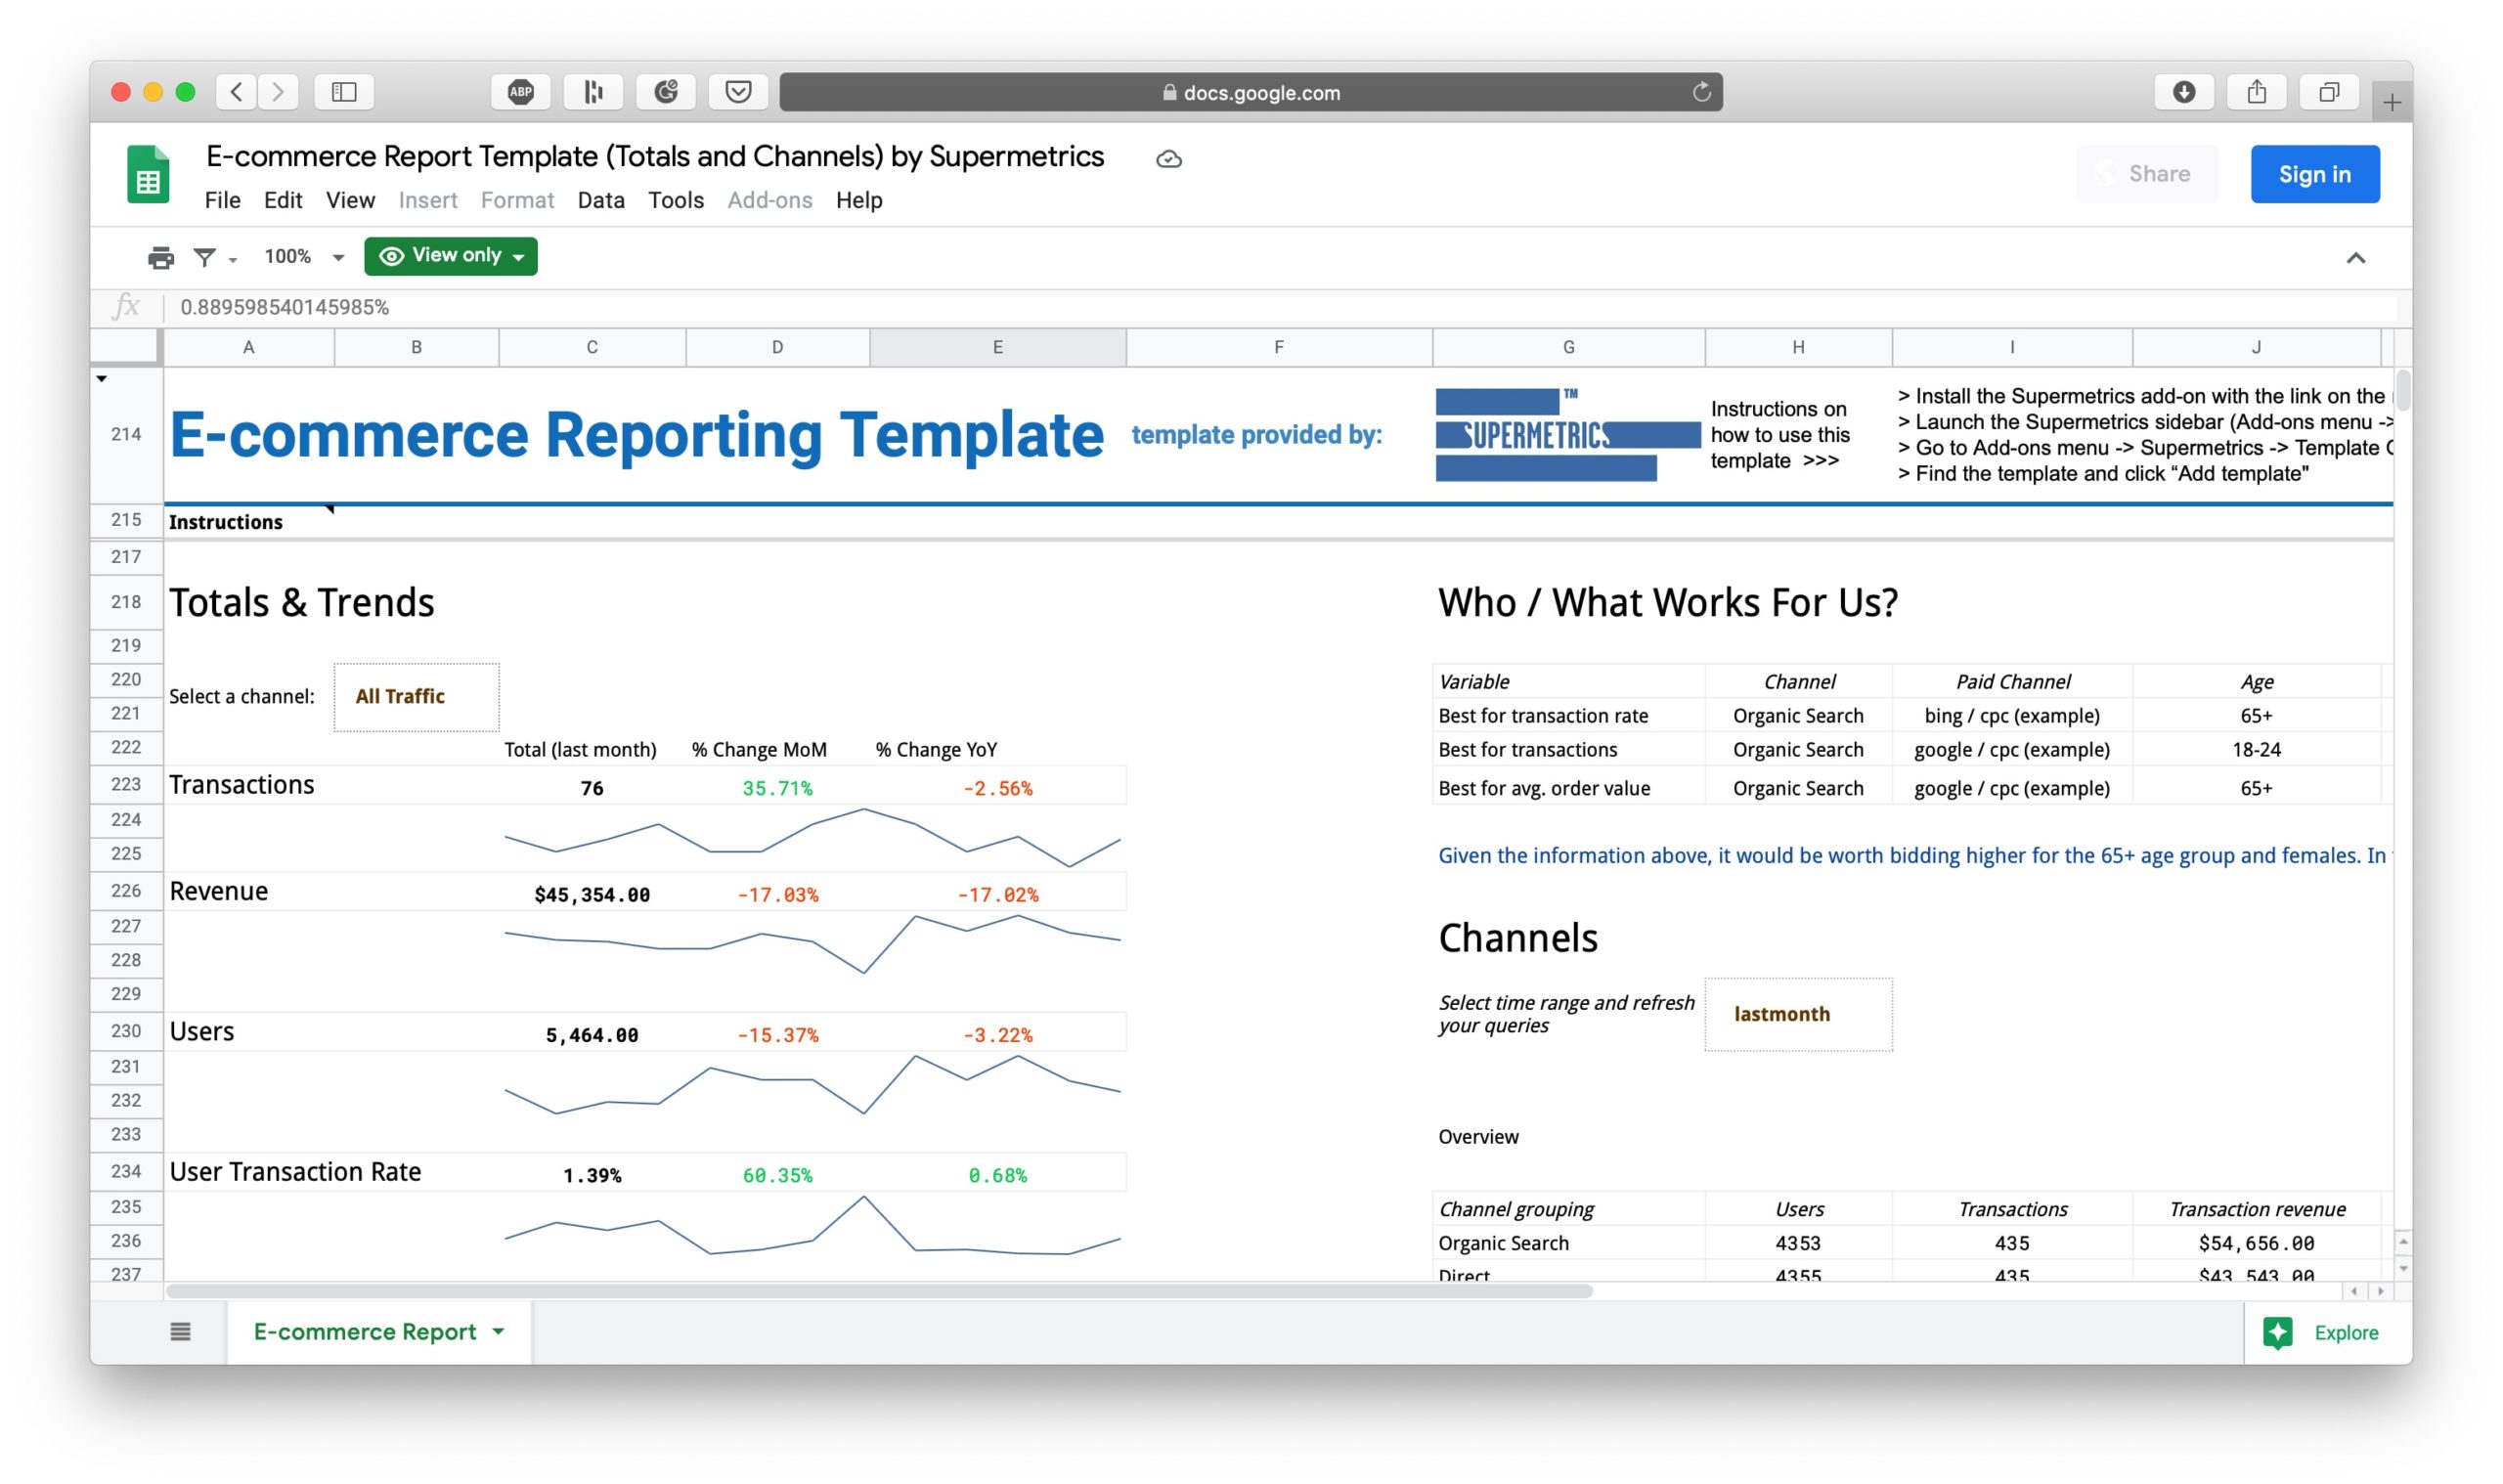
The problem you’re trying to solve with a data aggregator is to automate and error-proof your copy/paste method, whether the end location is an Excel spreadsheet, Google Data Studio, or something else.
Some data aggregators, like Funnel.io, require users to funnel data into their proprietary platform first before they can upload it to their analytics tool of choice. This doesn’t solve the automation problem directly, and it adds unnecessary complications to the process.
Eliminate the learning curve and choose a data aggregator that will gather data in the reporting tool you were already using, such as Google Sheets, Excel, Google Data Studio, BigQuery, or Snowflake.
(Source)
Creating a Single Source of Truth for Ecommerce Data is Worth It—If You Can Automate It
Using data to power your ecommerce decisions and strategies will skyrocket your growth. But the challenge most companies face is getting all their data into a single reporting tool for easy and fast analysis.
The typical copy/paste method is tedious, time-consuming, and error-prone. Investing in a data aggregator will automate this process and keep all your data up to date.
As a result, you’ll be able to use your data the way you were meant to: To make sound, strategic decisions and grow your company year after year.


