The Complete Guide to Conversion Rate Optimization for First Year Stores
If you run a new ecommerce store or a store with low traffic and want to get more of your visitors to buy, you’re in the right place. Many online store owners believe that to optimize their store they need to have a lot of traffic.
Wrong.
The truth is you can optimize any website, even ecommerce stores with little to no traffic.
Ok sure, you can’t run A/B tests that reach statistical significance, but as an ecommerce entrepreneur you’re not a scientist anyway, you’re a business owner.
You can, however, learn about your business, make changes to your website, and see increases in your revenue and most importantly profits.
In this in-depth guide to optimizing online shops with low traffic you’ll learn:
- Common myths about conversion rate optimization (CRO) and low traffic websites
- A process for low traffic ecommerce conversion rate optimization
- Step by step how to optimize your low traffic ecommerce store
- The real secret to ecommerce optimization and online business growth
Let’s get right into it.
Myths About CRO & Low Traffic Stores
Let’s learn more about the common myths around optimizing ecommerce stores with low traffic.
A/B testing is not the only way to optimize an ecommerce store
A/B testing, also referred to as split testing, is when you compare two versions of a webpage or website and see which one performs better. Simply put, this means you learn which design makes you more money.
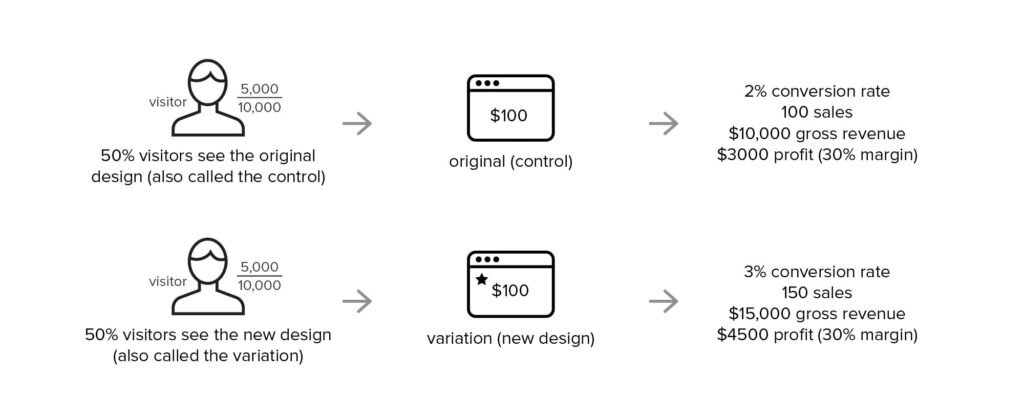
For example, if you showed 50% of your visitors your original web page design and 50% of your visitors a new web page design, you could then compare which design generated the highest conversion rate, revenue and most importantly profit.
To do A/B testing properly you need to have a large enough sample size, this simply means you need a certain amount of visitors to go to the website and complete your desired action (like checking out) for the test to be proven. The number of visitors and conversions needed can be worked out using an A/B test calculator.
The problem with low traffic ecommerce stores is it takes too long to get enough visitors and completed checkouts to complete the test, like 1 year maybe for some people — ouch.
But don’t fear! A/B testing is not the only way to improve your ecommerce conversion rates as you’ll learn in the next section.
Measure your optimization efforts’ success using your bank account
Now, many conversion experts will argue: “How do I measure whether the new website changes are making more money if I can’t run an A/B test.”
That’s easy, you look at your bank account. You can compare your shop’s profits before and after you launch the website changes.
Now, while this is technically called sequential testing as it doesn’t test the same visitors from the same time period, it can still be used as a benchmark for growth. And as most low traffic shops are fairly new ecommerce stores, it is normal to actually see a lot of growth when making informed website changes.
Don’t optimize for conversion rates or revenue, optimize for more profits
Let’s be clear about something: The point of conversion optimization is not to increase conversion rates.
Wait, wait, I know… Let me explain.
It is actually damn easy to increase conversions; just sell everything for $1 — boom! — conversion rates are through the roof!
The key to optimizing your ecommerce store is not even about revenue, but profit. If you change your business model, like offering free shipping, you can make more money, but still make less profit because of increased overheads. So, when thinking about conversion optimization, focus on increasing your profits monthly.
Ecommerce optimization is about increasing profits, not conversion rates or gross revenue.
Low Traffic Optimization Process
Before you dive in and start optimizing your store, you need to learn the big picture process of low traffic ecommerce optimization.
Let’s look at the process you will follow to optimize your store:
- Check if your traffic is too low for A/B testing
- Make sure your Google Analytics account is set up correctly
- Understand what your business looks like now & what you want it to look like (your business objectives)
- Collect data from your website, leads, and customers
- Launch the new design & watch your bank account
A Step-by-Step Guide to Optimizing Low Traffic Stores
Ok, so let’s get started. Next up you’ll learn step-by-step how to optimize your low traffic ecommerce store.
Step 1: Check if your traffic is too low for A/B testing
The first step is to answer the question: “Do I have a low traffic website?”
Conversion expert Bryan Eisenberg suggests that if you have less than 10 sales per week on your store, it is a low traffic shop. Rich Page, another conversion optimizer, says that a website getting 1k visitors per week or less is low traffic.
For those still looking for a benchmark number: If you get 5,000+ visitors a month, or 500+ sales a month, you might be able to run A/B tests. For the rest of us, it’s on to step 2.
Step 2: Make Sure Your Google Analytics Account is Set Up Correctly
Even though you don’t plan to run A/B tests, it’s still important to be able to understand where your sales come from and what marketing channels give you the best return on investment for your spend.
Therefore, the second step is to make sure you’ve set up for Google Analytics account right and that you’re collecting accurate data.
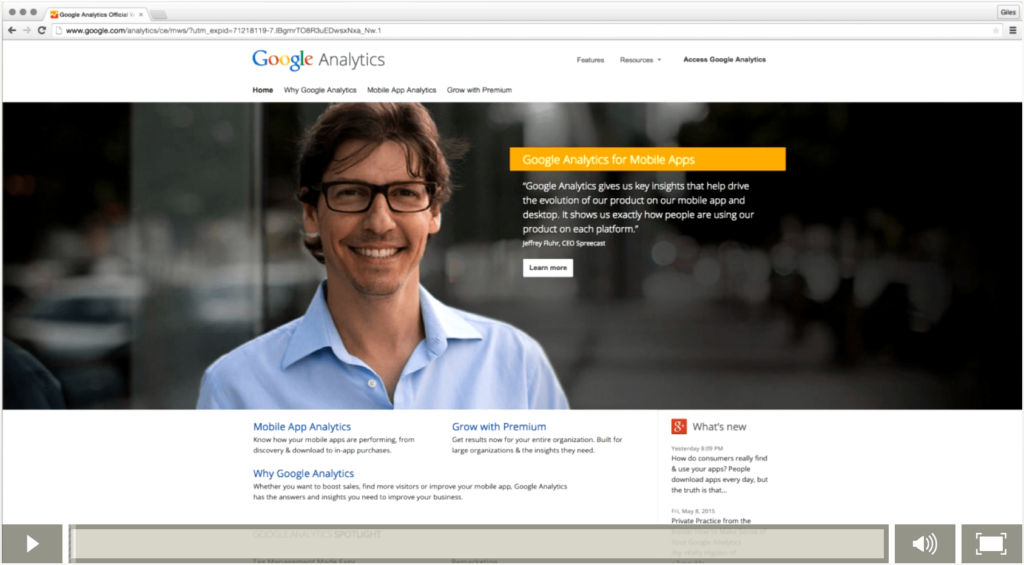
Watch the video below and check your Google Analytics account settings against the recommendation in the tutorial.
Step 3: Understand what your business looks like now & what you want it to look like
It may surprise you, but a lot of people don’t really track their businesses properly. It normally comes down to fear.
I know, because I’ve been there and I’ve seen it again and again when mentoring startups for the Google Launchpad Accelerator. It’s scary to dig into the data in your business and really get to grips with how well you’re doing.
Ok, so it’s not so bad skimming through your bank account, but to really dig all the details out and have them stare back at you from a spreadsheet can be daunting.
Next, we are going to set fear aside, take a deep breath and for the first time for many of you, really get to grips with what your business looks like now.
Getting & Setting Your Business Objectives
To measure growth from your optimization efforts you need to understand and record what your business looks like now and after you publish your website changes.
To measure whether or not you hit your targets you need a plan. This plan is called your business objectives. Your business objectives are made up of:
- Objectives
- Goals
- KPIs
- Targets
Let’s go through each one and learn what they mean in the context of a swimsuit store.
Objectives
A business objective for an ecommerce store that sells swimsuits would be: “Increase our sales by receiving online orders for our bikinis.”
Goals
Goals are taken from your business objectives. A goal for our swimsuit business could be: “Increase the number of swimsuits that are checked out.”
KPIs
The difference between some random data and a KPI is when is it measuring something connected to your business objectives. For example: For the business objective: “Increase our sales by receiving online orders for our bikinis.”
Our KPI would be the number of bikinis sold in a given time frame, like the number of bikinis sold per month.
Targets
For your KPIs to be actionable, they need to have targets. Targets can be taken from your current business data and then projected forward in time for each KPI.
For example: If we sold 20 bikinis last month, a good target for the next month would be a 10% increase. Therefore, our target would be 22 bikinis sold next month.
Let’s recap:
- Objective: “Increase our sales by receiving online orders for our bikinis”
- Goal: “Increase the number of swimsuits that are checked out”
- KPI: Number of bikinis sold per month
- Target: 22 bikinis
To make this simpler, I have created a spreadsheet where you can input your current business data and objectives (into the blue fields) and it will calculate your next month’s target based on a 15% conversion rate increase (in the grey fields).
At my ecommerce CRO agency, we normally shoot for 5-10% month-over-month growth, but as your stores and businesses are new, you can be more aggressive in your growth planning.
![]()
To make a copy you can keep and edit, just click ‘File’ and ‘Make a copy’. This will save a copy of the spreadsheet to your Google Drive.

Input your data from the past three months for your ecommerce conversion rate, number of sessions, number of transactions and average order value and the spreadsheet will calculate the other fields.
You need three months of data to create an average. Otherwise, your data may be incorrect due to a seasonal spike or dip. If you don’t have three months of data, just use what you have at hand.
The average will then be projected forward to calculate your targets.
You can find this data in your Google Analytics account or in your Shopify dashboard (if you haven’t set up Google Analytics properly yet).
Finding your current business data in Google Analytics
Go to your Google Analytics account and navigate to Conversions > E-commerce > Overview.
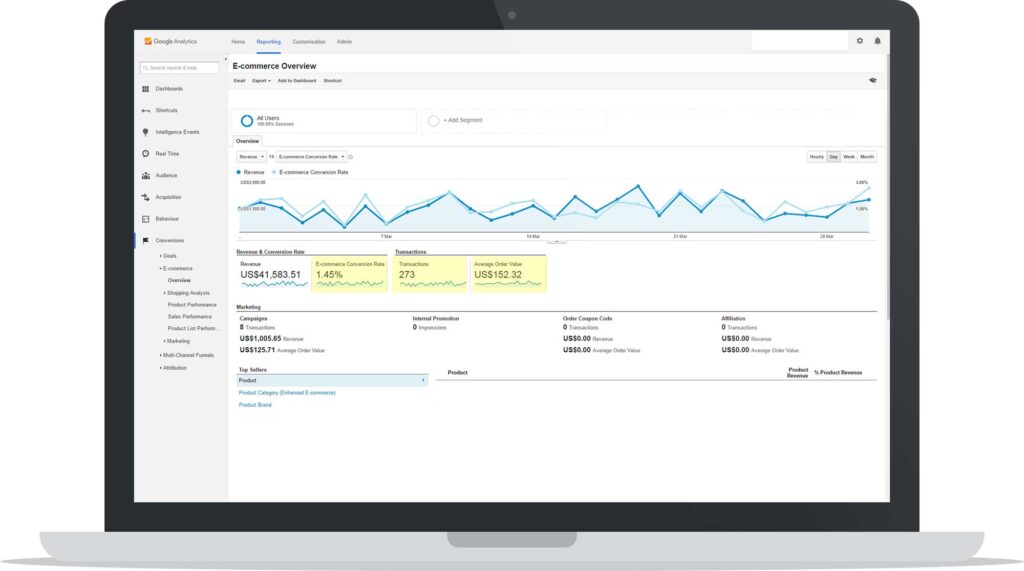
Here, you can see highlighted in yellow: Ecommerce Conversion Rate, Number of Transactions and Average Order Value.
Next navigate to: Acquisition > All Traffic > Channels.
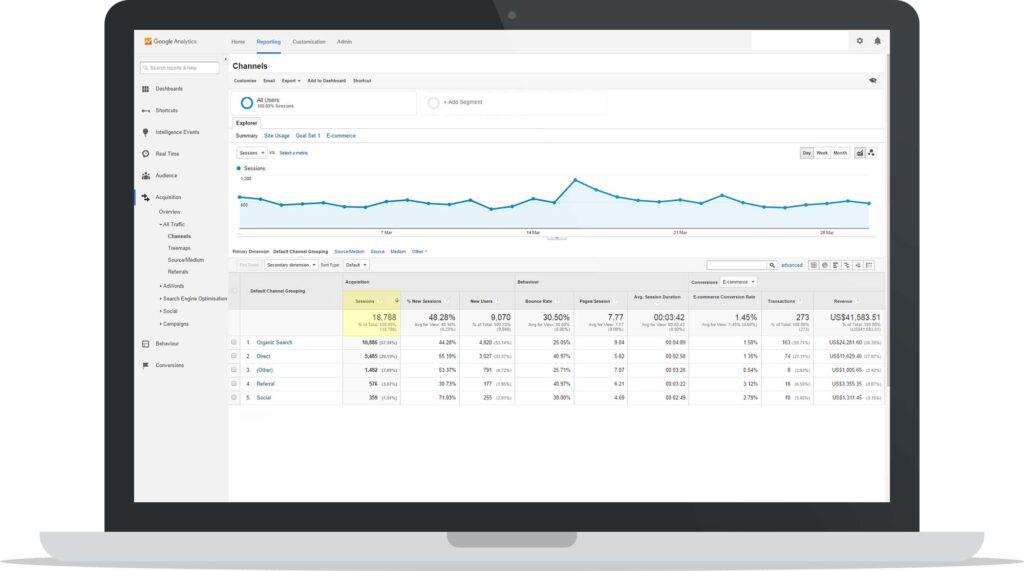
Here, you can see highlighted in yellow: Number of Sessions.
Make sure you select the last complete month, starting from the first Monday to the last Sunday in the month in your date-picker in the top right of Google Analytics. Then, work backward and check the previous two months and input them into the spreadsheet
Finding your current business data in Shopify
Open your Shopify admin and navigate to: Dashboard > Online Store or go to https://yourshopname.myshopify.com/admin/dashboard/online
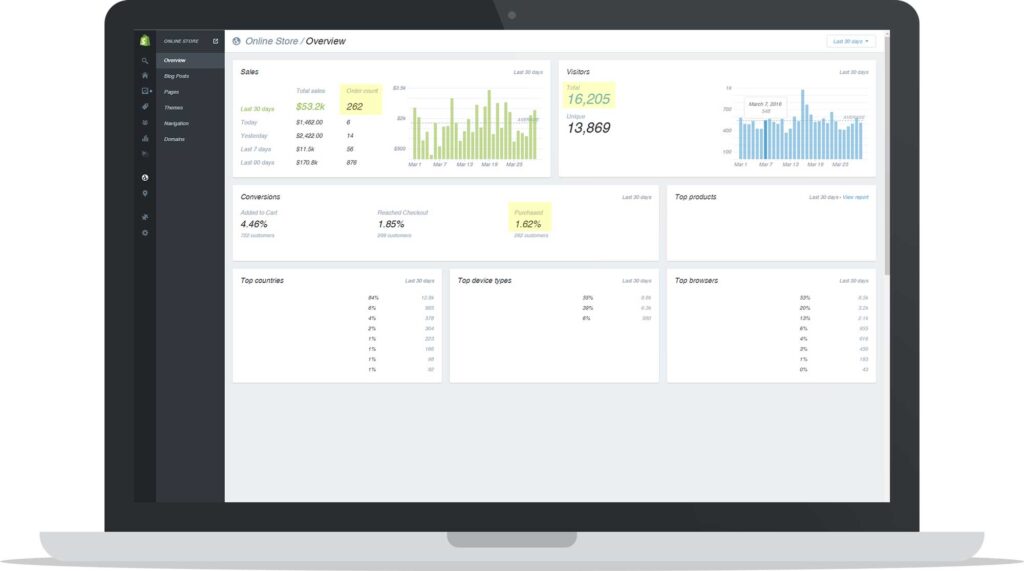
Here, you can see highlighted in yellow: Ecommerce Conversion Rate, Number of Transactions, and Number of Sessions. Average order value can be worked out by dividing the total sales by the number of transactions. For this example that would be: 53.2k/262 = $203.05
Ok back to the spreadsheet.
You should also update your profit margin field. As a default, it is set to 30%.
![]()
To help you keep track of your targets throughout the month, the bottom of the spreadsheet gives you daily, weekly, and monthly target projections. That way you can check in every day or once a week and see if you are on track to hit your targets, giving you time mid-month to make adjustments where necessary. Again, don’t forget to use the Shopify date-picker to choose the last month Monday to Sunday and then work backward through the previous two months.
Once you have inputted the last three months data you should now see what your averages look like and what your targets for next month are.
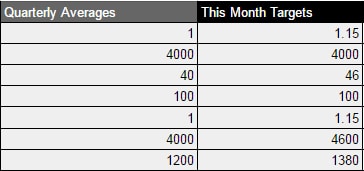
At the end of each month, you can then put in the real results you achieved and compare them to your targets. And remember, it doesn’t matter if you are way off on your targets, you can simply adjust the baseline expectation for next month. But, without setting and measuring targets, you’ll never know if you exceeded your expectations or not.
Alright! You’re now setting and reporting on business objectives like a boss!
Step 4: Collect data from your website, leads & customers
There are two main types of data you should collect from your business when performing an optimization process: Quantitative data and qualitative data.
Quantitative -> Quantity
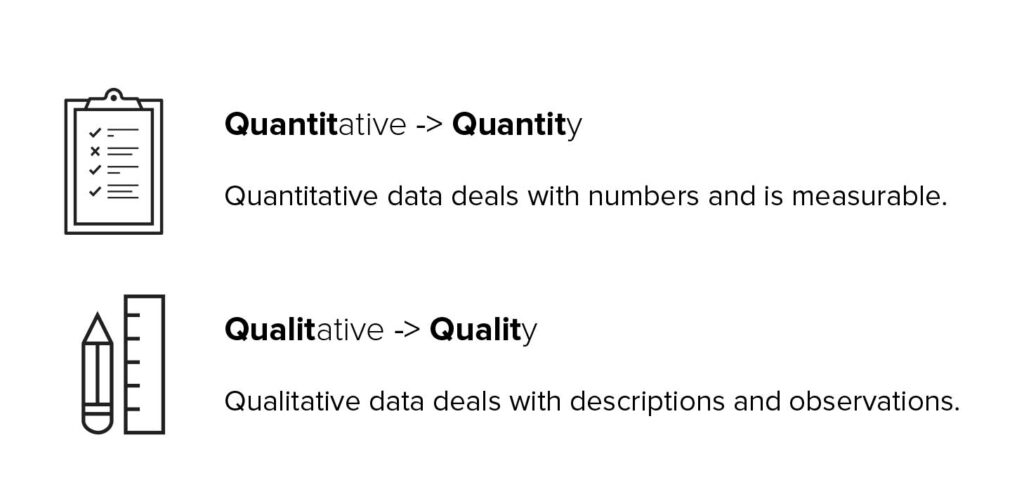
Quantitative data deals with numbers and is measurable. This is like the what, where, and how of your business: What do people click on your website, which pages do they go to and where do they leave your website from? Examples of quantitative data are Google Analytics reports and email newsletter reports (like in Mailchimp or Klaviyo) but it really just refers to anything in your business which is measured like 5 socks sold, 3 t-shirts shipped, etc.
Qualitative -> Quality
Qualitative data deals with descriptions and observations. This is the “why” of your business: Why do people leave the website on the cart page, why don’t people understand the product descriptions? Examples of qualitative data are user testing, customer interviews, and customer surveys.
Now, this may sound confusing and complicated, but really it’s not.
Optimizing your store can be boiled down to one simple sentence: “Learn where people are leaving your ecommerce store from, learn why and fix it.”
Because your websites are pretty low traffic you won’t focus so much on quantitative data, although it will play a role. You will focus more on qualitative data.
The reason qualitative data is so valuable for a new business is because it focuses on customer understanding.
That’s why qualitative data is so powerful because it helps you to answer the big questions in your business like what is your value proposition (more on that soon), who are your target customers, and what are their pains and desires.
Before you get started collecting data you need to think about what questions you are trying to answer with the data and the simplest way to do that is to think about what you will need to create to improve your website and what do you need to know to be able to do that well.
Well, the most important work ahead of you is actually copywriting.
The words you write in your ecommerce store will make or break a sale when a user is on the fence about checking out or abandoning your cart page. Sure design is important, but with a new business, the most important thing is writing a killer value proposition for your target customer.
That’s where these two handy documents come in:
- Customer Personas
- Value Propositions
Let’s learn more:
Customer Personas
Your customer persona is a fictional representation of your target customer. It helps you to visualize and speak to a specific person with real emotions, problems, and desires when creating marketing and sales materials.
Your company’s customer persona is made up of these sections:
- Demographics
- Behavioral Drivers
- Goals (in order of importance)
- Obstacles to Purchasing
- Mindset
- Words Used by Prospects
- Real Quotes from Customers
Let’s go through each section and give an example using one of my clients, Haute Hijab:
Demographics
Your customer demographics are the simple facts around who your customer is and include:
- Name
- Age
- Sex
- Location
- Image
For example:

- Name: Manda Saab
- Age: 26
- Sex: Female
- Location: United States, California
Behavioral drivers
These encompass the customers’ goals, what they want to accomplish, their challenges, their journey to finding your company.
Example of goals:
- Find fashionable hijabs that are also comfortable
- Look cool and respect her religious beliefs
This section should also include a few paragraphs about:
- Who the customer is (what is their current situation)
- What their true goal is (what benefit does your product enable)
- What their customer journey looks like (how do they find out about your company and buy)
Obstacles to purchasing
Consider the hesitations and concerns the customers have. How do they view your product and how does that impact how much information they need to make a decision?
This should be a bullet point list of the important things they consider when making a purchasing decision.
For example:
- How the product is delivered
- When it is delivered
- What are the refund policies
Mindset
The customers arrive at the buying experience with expectations and preconceived notions. What are they?
These are common reservations visitors have around purchasing from you. They can often include and be connected to:
- Outcome after they buy or finish using the product (for example: proof of results or quality)
- Will your product solve their pain point
Visitor Vocabulary List
This is a list of the most commonly used words your prospects use. Specifically, the words they use to describe their problems and desires. For example:
- Comfy
- Hot in summer
- Look trendy
Real Quotes from Customers
These are things real customers have said to you in interviews or emails or in person. They should again explain how they feel about their problems and pain points and what their one true goal is. For example:
“I want to look fashionable but respect the rules of my faith”
So when collecting data you now know you need to fill in this template for your business and be able to answer the questions from the different pages.
Value proposition
You value proposition is the why, what and how of your business. Why someone should spend money with you, what you do or offer and how you uniquely do it. Your company’s value proposition includes these sections:
- Headline
- Subheadline
- Bullet points
- Image/Visual representation
- Call-to-action
- Social proof
- Guarantee
Now let’s go through each section and explain what it represents and look at an example.
Headline
First is your headline or H1, this should focus on the outcome or benefit of using your product or service. Ask yourself what result the prospect wants. For example:
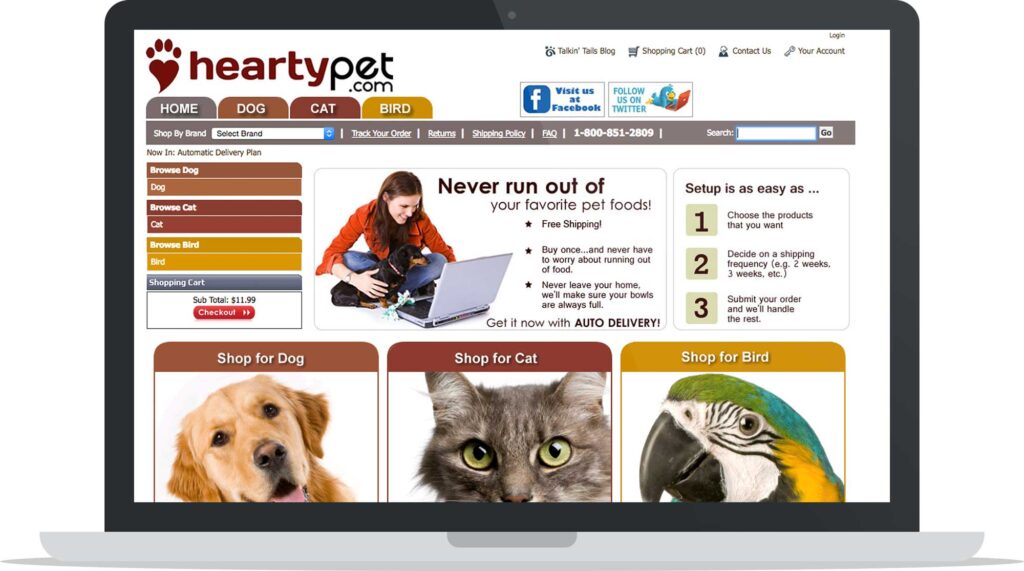
Heart Pet says: “Never run out of your favorite pet food.”
When writing this sentence keep asking yourself “how?” and be more specific! This will allow you to improve your relevance and brand positioning. For example:
- Never run out of your favorite pet food
- Never run out of your favorite dog food
- Never run out of your favorite dry dog food
Subheadline
Second is your subheadline, this is often an H2 or a two to three sentence paragraph. This should focus on how your product or service enables the outcomes and what makes it unique. For example:
“Hearty Pet is unique because the food auto-orders after the first purchase.” This could be improved with clearer copywriting.
Ensure you write specific facts too. For example, “The largest online shoe store” has little meaning and can be considered marketing mumbo jumbo. But “Selection of 56,487+ pairs of shoes” is specific enough to have an impact.
Bullet point list
This list should further communicate the benefits and unique value your product offers. The easiest way to create this list is to take your top three features that are perceived as high value by your prospects and write their outcome or benefits.
Turn your features into benefits and position them to what your prospects value. For example:
Hearty Pet:
- Free shipping
- Buy once
- Never leave your home
Image/Visual representation
The images or video that support your copywriting should illustrate the product or service further. For example: The Hearty Pet website shows the owner with their pet ordering the food from home.
Call to Action
When it comes to designing your website for higher conversions you need to pick one main task for the user to complete on each page. Then focus the visual hierarchy of the design on that task to help push your user down your sales funnel.
For example: Hearty Pet has a simple red checkout button, this is too small and to low in the visual hierarchy. Also, the messaging on the button should be tied to the core value proposition such as by saying, “Order your monthly pet food delivery here.”
Social Proof
You know people are skeptical when making purchasing decisions and often need proof to push them over the conversion line. Hearty Pet does not use social proof, but they do link to their blog and social accounts.
Other forms of proof you can use are:
- Customer testimonials or stories
- Case studies with hard facts or data
- The size of your community and your reach
Credibility
Similar to social proof this is why your customer should trust you as the expert. What qualifies you to teach them, advise them, have the knowledge to solve their problems.
You can reference people in your company or yourself and show credibility such as:
- Past experience or length of experience (10 years in the industry)
- People you’ve worked with in the past (company logos or people)
- Publications you’ve been cited on or written for (blogs, newspapers, magazines)
- Organizations you are associated with (mentorship programs, clubs, associations)
- Qualifications (higher education, practical qualifications)
- Awards or recognition (industry awards or prizes awarded to you or your business or employees of your business)
Guarantee
Even when you have amazing metrics to show off your product, people want and often need guarantees in order to convert. This can be in the form of a free trial or a money back guarantee.
People want the risk of working with you to be removed, this can be calculated as such: Motivation = perceived benefits – perceived costs. By removing risk you reduce the perceived cost of buying from you and increase the motivation to buy!
For example: Hearty Pet offers a “cancel anytime” subscription, and does not make you sign up for a minimum number of months.
Again you can now see what questions you need to answer to complete this template from your customer research.
Let’s start collecting data to improve your business.
Over the next sections you’ll learn:
- How to conduct simple customer interviews
- How to use Google Analytics to learn where people leave your website
- How to use Hotjar to learn why visitors leave your website
These are just three examples of data you can collect and analyze to learn about your customer, learn where they are leaving your website and learn why. To learn all my ecommerce optimization process for all possible data course you can check out my online course Conversion Machine.
Let’s start with the holy grail of data sources for understanding your customers: Customer development interviews.
How to Conduct Simple Customer Interviews
Customer interviews can be split into two main types: Behavior studies and feedback studies. The interviews are as simple as they sound, questioning your customer and learning from their answers.
Behavior studies allow you to learn about your target customers or leads and their pains and desires. Feedback studies allow you to learn about your customers, why they bought from you and how you can improve your product.
These learning help you to complete the above templates, your personas and value propositions.
Here are two sets of template interview questions you can use to improve your store:
Behavior Study
- “What’s your biggest [your topic] challenge/goal right now?” This teaches you their one big pain or one true goal
- “Why do you want to achieve/overcome this challenge/goal?” This teaches you their desired outcome, what is the end result of fixing their pain or completing their goal
- “How do you currently [fix their pain or achieve their goal]?” This teaches you about competitors and potential shortcomings in your industry
- “What do you like or dislike but the process?” This teaches you the “how” to improve the user experience in your industry
Feedback Study
- “How did you learn about [name of your company]?” This teaches you which marketing efforts are proving successful
- “What made you want to try our product?” This teaches you the “why” of your value proposition
- “What other options did you consider?” This teaches you about your competitors from the point of view of your customers, often different competitors to what you thought about in the past
- “What feedback can you give us on your experience with our business?” This is as simple as it sounds, how do you do what you do, but better
Top tips for running really good interviews:
- Speak to at least 5 people for each study type, if you can talk to 10 even better, stop when you start hearing the same answers again and again
- Don’t takes notes, record the interview audio or video and just listen and ask good follow up questions (just ask “why?” to everything they say). You can use Pamela Call Recorder for Skype or Piezo Audio Recorder
- Do the interviews in person if possible, people speak with their body language too, so it’s good to see them as well as hear them
- Transcribe the interviews, writing down their exact words, not your interpretation of them. You can then use these learnings in your persona templates, Visitor Vocabulary List & Real Quotes from Customers.
Use Google Analytics & Hotjar to learn where people leave your website
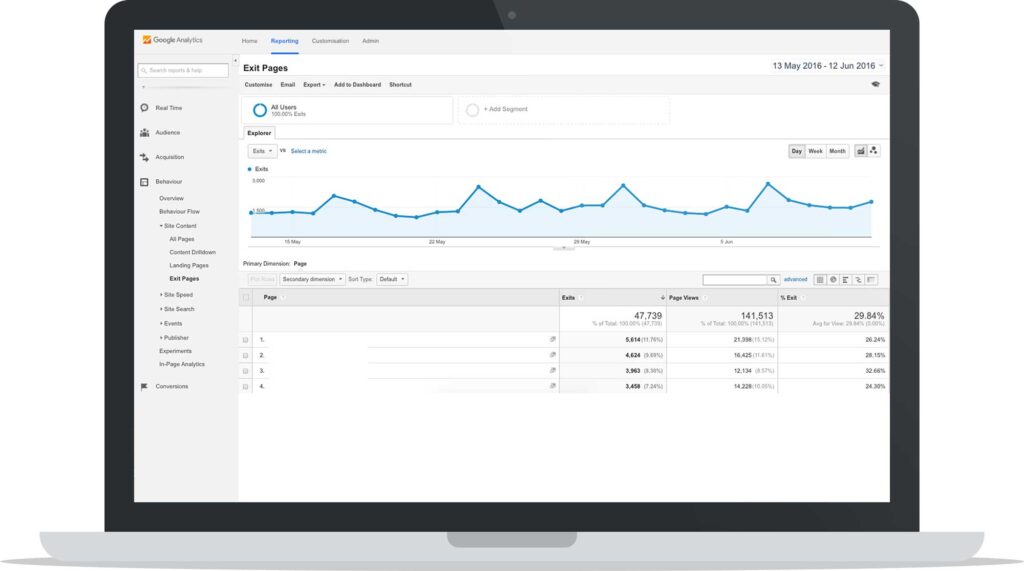
Next, you are going to learn which pages the majority of your visitors leave your website from. These are called your “exit pages” in Google Analytics.
If you have Google Analytics installed you can simply navigate to this report and view the pages now: Behaviour > Site Content > Exit Pages.
You can also use the Google Analytics Funnel Visualization Report you learned how to set up in the video earlier in the post.
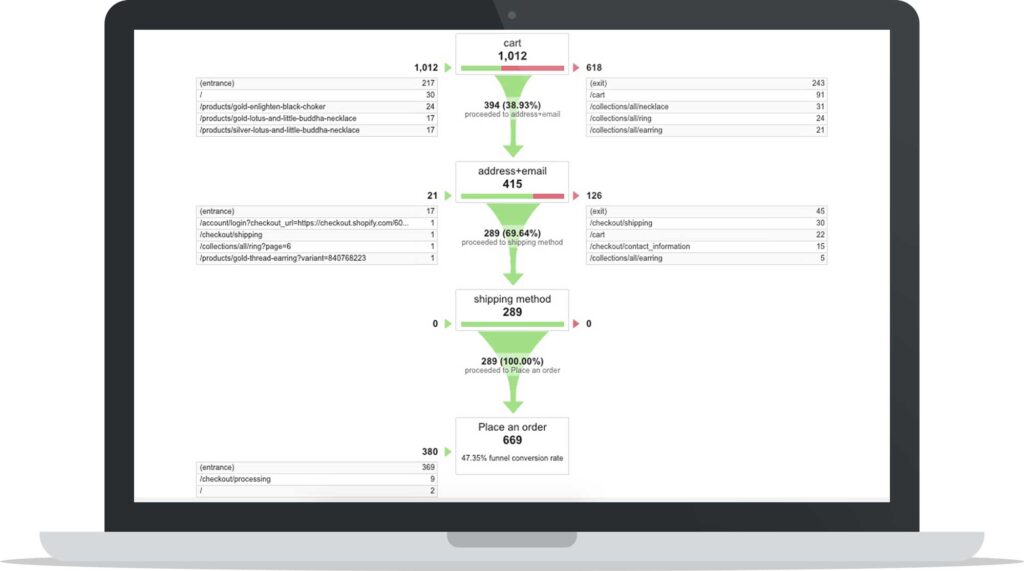
Look for the step with the biggest drop off or exit percentage. In this case, it is from the cart page. Now you know where people are leaving your ecommerce store from, you can learn why and fix it.

Use Hotjar to learn why visitors leave your website
You are going to install Hotjar, a popular optimization tool and poll your visitors. You will use something called exit intent technology. This is when a visitor tries to leave your website and just as they go to click the tab or browser cross to close the window you show them a question. The question will depend on the page most people leave from, for example, if your funnel showed the majority of visitors leaving your website from your cart page as in our example your question could be: “What is stopping you from checking out today?”
This teaches you the reservations or information gaps people have when visiting your website so you can fix them.
Examples of different answers may be:
- I’m not sure if you ship to New York?
- I can’t see the expected delivery date?
- What are your return or refund policies?
- Do you offer a money back guarantee?
The reservations your visitors have and information they’re missing to be comfortable to make a purchase can then be added to your product pages and cart page to make sure in future they feel confident to check out.
Step-by-step how to set up a Hotjar poll on your cart page
First, sign up for a Hotjar account. Once you sign up you will need to install the Hotjar tracking code into your store.
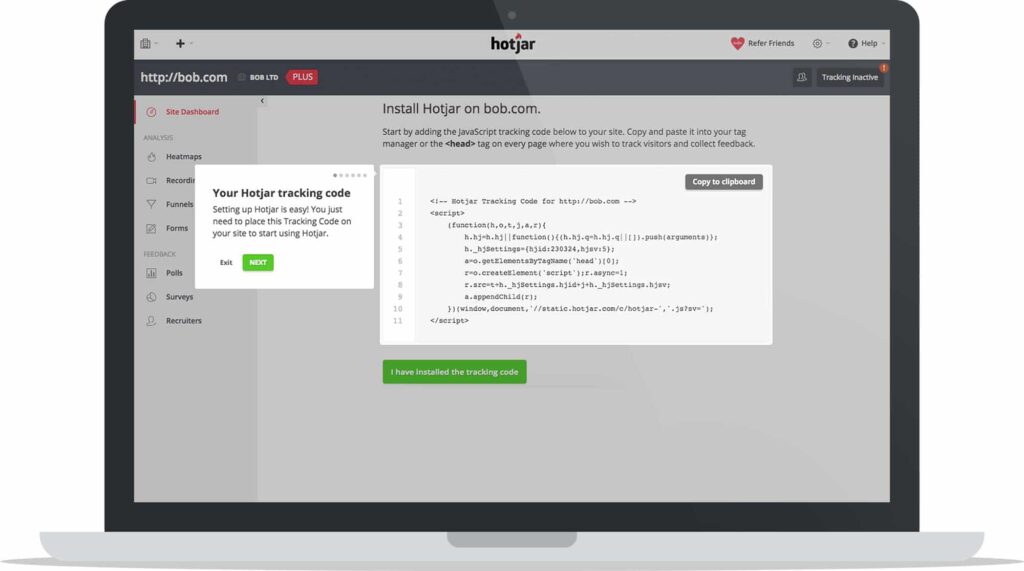
This is a piece of javascript should be pasted into your theme.liquid file. You can do this easily by navigating in your Shopify admin menu to: Dashboard > Online Store > Themes > Edit HTML/CSS.
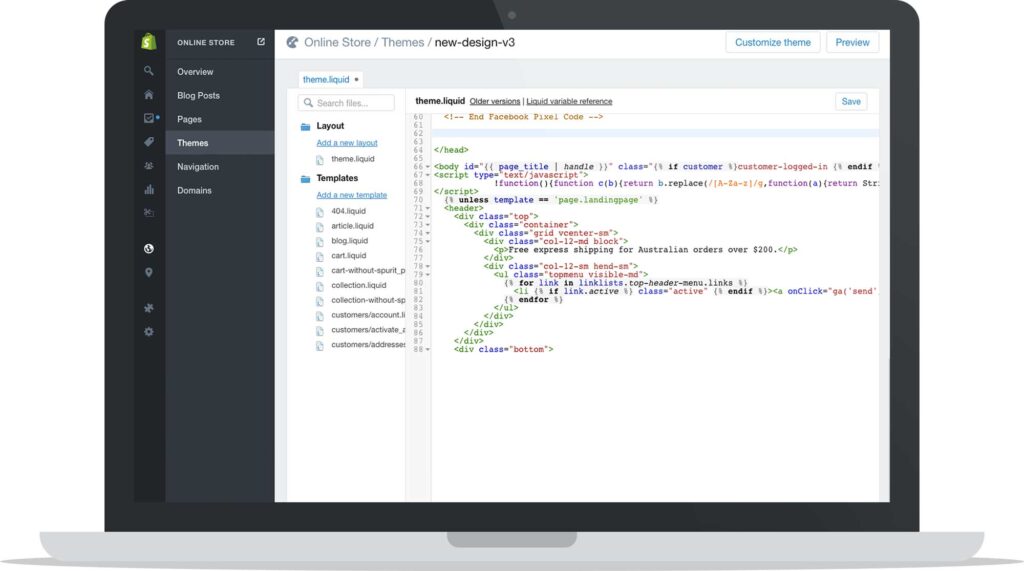
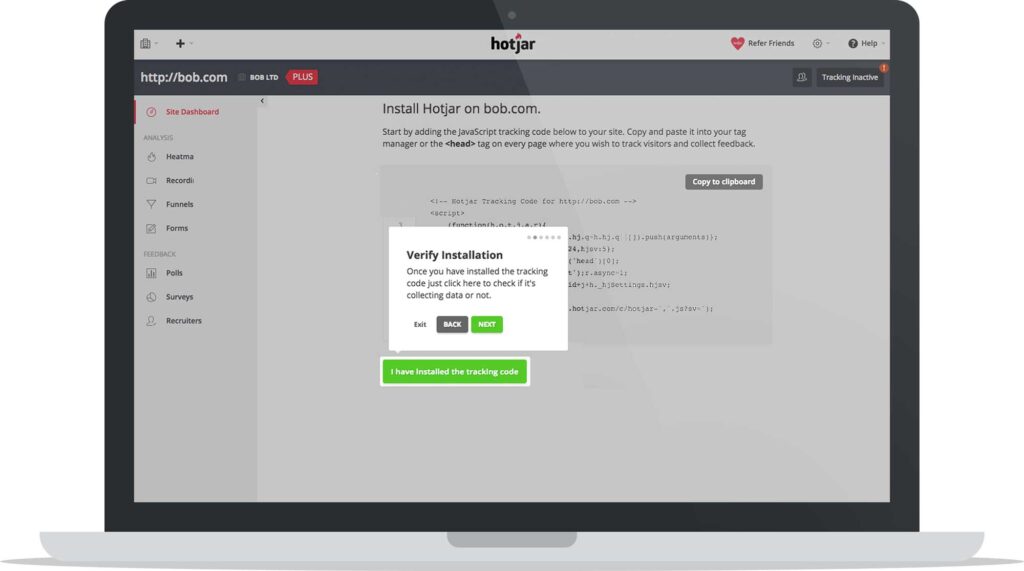
Paste it in the <header> tag or use Google Tag Manager to manage all your plugins and tools then verify the code is installed.
Next click on Polls. Then click “New Poll”
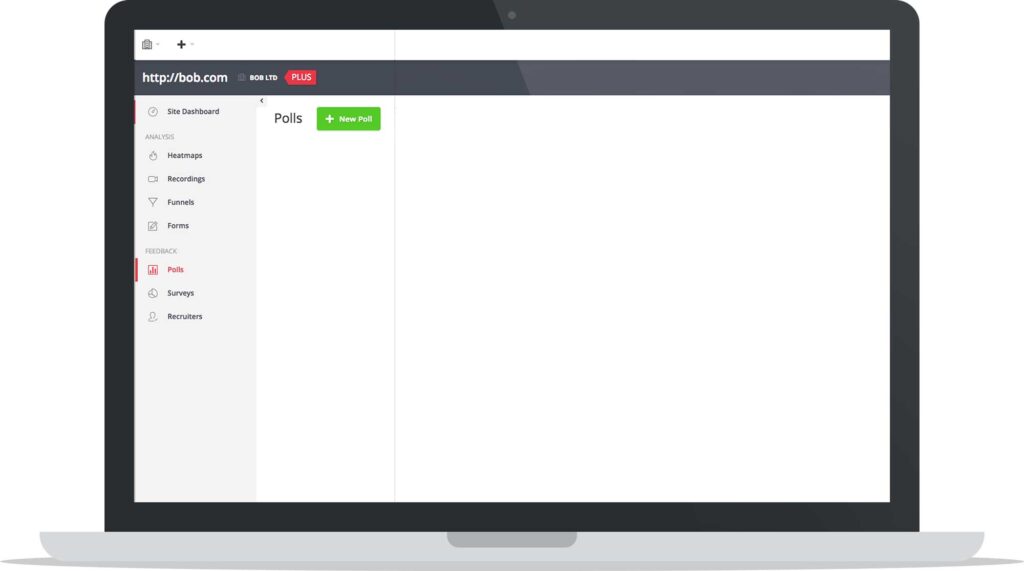
Nex,t add in your cart page URL within page targeting. Choose all devices. And add the question: “What is stopping you from checking out today?”
Make sure to set the popup setting to be: “When user is about to abandon page on a desktop device.” Then set the poll active.
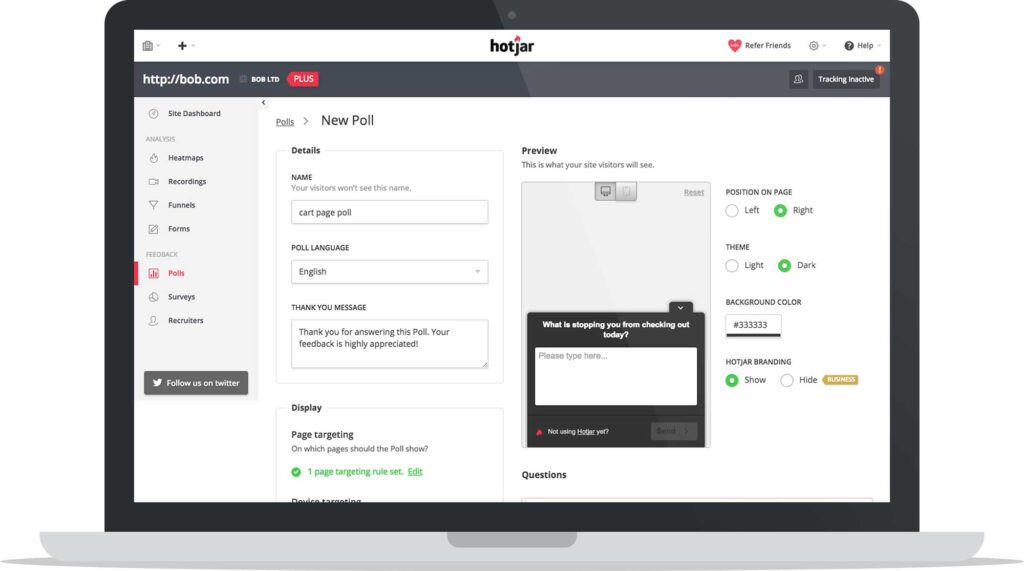
Next, you need to wait for your visitors to respond to your question. How long it takes will depend on how much traffic you get to that page. Here is an example of what your poll data could look like:
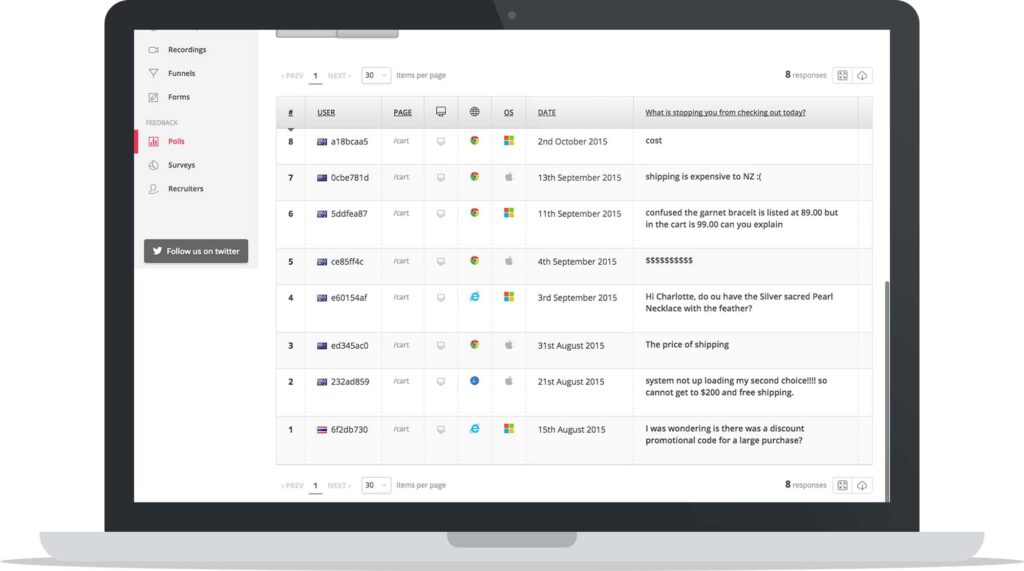
As you can see there are a number of different concerns and questions visitors have. You can then make sure you answer these questions on your product pages and cart pages, in turn improving your conversions.
You can keep repeating this process of finding the biggest leaks of visitors in your sales funnel and then trying to learn why people leave from this step.
Other types of data you can collect to learn why visitors leave are user testing, visitor recordings, heatmaps, live chat and more.
Launch and test your new website changes!
Conclusion
During this guide, you’ve set up your Google Analytics account, created your business objectives, and started digging deeper into what makes your customer tick. You also learned where visitors leave your ecommerce website and why they leave using sales funnels and polls. The next step is to make the necessary changes to your website based on the data you collected and launch your designs.
From the customer development interviews, you can create your customer persona and value proposition documents. You can then use these to improve your value proposition on your homepage and speak more directly to your target persona in your copywriting.
From the sales funnels and poll data, you can learn what information is missing in your store and add it in, so visitors get their common questions answered and feel confident to check out.
And remember to keep iterating on your store. There is no point running one poll and making one change, always be optimizing your store’s biggest leaks and use different sources of qualitative data to learn why you have problems and fix them.
Finally watch your bank account, are the changes you make helping your business grow? Make sure to update your spreadsheet. You should always be tracking and measuring your business efforts.

